
From time to time when discussing FAIR risk analyses conducted with the RiskLens software, I'm told something like, "You can't defend the answers". These statements are almost always about quantification and not about FAIR itself. And when pressed, the reason almost always comes down to some mix of the following reasons:
1. FAIR gives you consistency At its core, FAIR is both a taxonomy and a model. The taxonomy (a set of terms) gives you a uniform way to talk about risk. The model (a set of relationships among those terms) gives you a standard way to compose risk. This may seem like a simple statement, but the results are profound. These two attributes force users to approach risk analysis the same way every time. It doesn't matter if we're talking Ford Pintos or cyber attacks by nation-states. Thus, the two attributes inject structure into conversations about risk. From how the risk is defined to how it will be ultimately quantified. To use FAIR, you don't deviate from its definitions. Neither do you talk about risk in half measures; such as only talking about impact or only the event's frequency. It requires you to think through risk-based problems the same way every time. It gives you a structure for critical thinking. 2. FAIR reduces uncertainty (by isolating it) It's obvious that using a consistent method to evaluate risk will reduce uncertainty. You can rest assured that all aspects of the risk scenario were thoroughly evaluated. But the second argument is also about bias and accounting for a world that isn't uniform. Since we're humans, it's nearly impossible to remove all bias. Furthermore, the world can be unpredictable. That's why FAIR is so effective; the structure of FAIR allows you to isolate bias and uncertainty. It allows you to apply hard data where you have it and use estimates where you lack data, where there is variability, or when you lack visibility. For example, maybe you have high variability on how often an event happens month-to-month, but you have precise data on the financial impact. Or perhaps someone thinks the event happens more often than the data suggests, but they still agree on the impact. In either case, the uncertainty and variability are isolated. Furthermore, the use of distributions allows you to account for and express this. Which leads me to the third point. 3. FAIR analyses done with RiskLens have a solid mathematical foundation If mathematicians used inconsistent formulas to find the area of a circle, we'd all be in trouble. Likewise, if risk is defined inconsistently, no matter the math, you won't be able to depend on the results. Thankfully, we've already established risk can be defined consistently. But what about the math? And what about the biggest misconception about quantified results? (Don't worry, I'm not going to go deep into the weeds about math. I'll save talking about stochastic modeling and Monte Carlo simulations, which is what RiskLens uses, for another blog post.) The most common misconceptions about quantification is people think the results are a single number. Like a magical statement that some risk will cost the company EXACTLY $1 million dollars. That can't be farther from the truth! We never talk about a single value. In fact, if someone tells you the risk will cost your organization exactly $1.50 per lost record, run for the hills. Instead, with RiskLens, FAIR results are always probability statements. Such as, "The loss exposure is from $100,000 to $2,500,000 with a most likely value of $1,000,000." The outputs account for the uncertainty of the inputs. As uncertainty in the inputs is reduced so will the uncertainty in the output. Unless of course there is high variability in the risk being evaluated. (You can read more about the output in this blog post. 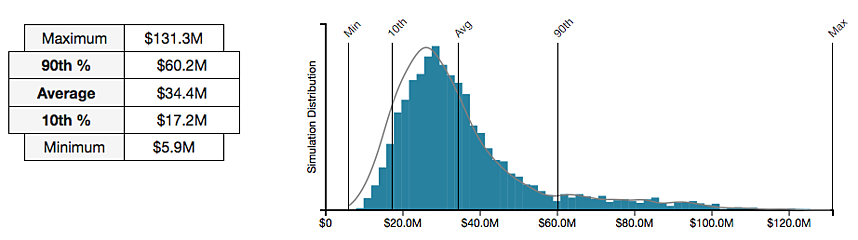 Results like the above are probability statements. In this example the potential loss is from $5.9 million to $131.3 million. With quantified results, you're now armed with the data you need to make real business decisions. Do you need further controls to mitigate the risk? The results can be compared to the cost of the mitigating controls. Perhaps you're evaluating your capital reserves or cyber insurance. You can decide if you have enough capital set aside for a disaster or if you need to transfer the risk with insurance. Either way the results are clear, usable, and defendable. Related: The FAIR Model Explained in 90 Seconds
- “This isn’t the way I do it.”
- “But what about bias?”
- “Math!”
| “FAIR analyses performed with RiskLens give you dependable results by requiring consistent application, which reduces uncertainty, and are based on solid mathematical principles.” |
|---|
Results like the above are probability statements. In this example the potential loss is from $5.9 million to $131.3 million. With quantified results, you're now armed with the data you need to make real business decisions. Do you need further controls to mitigate the risk? The results can be compared to the cost of the mitigating controls. Perhaps you're evaluating your capital reserves or cyber insurance. You can decide if you have enough capital set aside for a disaster or if you need to transfer the risk with insurance. Either way the results are clear, usable, and defendable. Related: The FAIR Model Explained in 90 Seconds