
 As the pandemic hit hard last spring, RiskLens offered as a service free tabletop exercises to help organizations quantify risk associated with two common work from home concerns: an increase in phishing attempts and the possibility of VPN overload.
As a consultant at RiskLens, I had the opportunity to work through these tabletop exercises, which were open to all comers and, to meet the high demand, conducted at high speed. Many of the organizations we helped had no prior exposure to the FAIR™ standard that’s the basis for risk quantification on the RiskLens platform – in fact, many came to the table believing they had no data for analysis.
The tabletops turned out to be a lab experiment that affirmed two principles:
- There's no such thing as having "no data".
- No matter where you are in your FAIR journey, RiskLens can help make FAIR fast and easy while achieving useful, defensible results.
RiskLens Analysis for Companies with “No Data”
The beauty of the FAIR standard is that it allows us to work at any level of abstraction. Whether loss events have occurred in the past, or we have never seen them, we can still make calibrated estimates to form our inputs.
Combine that with the power of the RiskLens platform that guides us through the data gathering process using workshop questions purpose-built on FAIR, and we have the flexibility to use what we know (no matter how much or how little that is).
Take a video tour of the RiskLens platform for a quick look at all the capabilities, including Rapid Risk Assessment, Risk Treatment Analysis, guided workshop questions and pre-populated data – all designed to make FAIR quantitative cyber risk analysis fast and easy. Contact us to learn how the RiskLens platform can work for you.
The best way to demonstrate this is through an example. Let's take a phishing scenario where we defined one key factor in the FAIR standard, Threat Event Frequency, as the probability of employees with access to PII in the Crown Jewel Database clicking on phishing attempts that contain malware.
Normally, we would look for existing data to inform our estimates. Examples of data we could use include: the number of phishing emails that landed in employee inboxes in the last year, employee click rate from a recent phishing awareness campaign, and the number of employees with access to PII in the Crown Jewel Database. However, this particular organization didn't have any of this information readily available. In fact, they didn't bring any data at all.
So how can we quantify risk in dollars and cents without any data?
The truth is that you need less data than you think, and you have more data than you think. In this example, we made a calibrated estimate of frequency based on two simple questions:
- How many times has this occurred in the past?
- How many times do we expect it to occur in the future?
The analysts were not aware of any past occurrences in which malicious external actors successfully gained network access via phishing in the past, but they were not confident enough to forecast that it would not occur in the next year. When we started talking in terms of timeframes, they were most comfortable using a ten-year threshold. Based on the ever-changing threat landscape, they forecasted this event would occur (at minimum) once in the next ten years.
Using this information, we formed a calibrated range of once every ten years at minimum to once per year at maximum, with a most likely value around once every five years. With "no data", we were able to use the experience of the analysts and a few assumptions to reduce uncertainty around frequency.
Fast FAIR Analysis and Defensible Results from RiskLens
Another key takeaway from the tabletop analyses was that FAIR doesn't have to be time consuming. A common misconception when it comes to quantitative analysis is that it takes too long to generate results. In each tabletop, we gathered data with subject matter experts from the organization, made calibrated estimates for the factors of the FAIR model, ran analyses, reviewed results, and refined inputs in less than an hour. In some cases, it was even quicker, and we had time to run multiple iterations of a scenario or run "what if" analyses to consider potential control improvement opportunities.
The reason we were able to do 'FAIR fast' was because of the preset features of the RiskLens platform - Triage, Data Helpers, and Loss Tables.
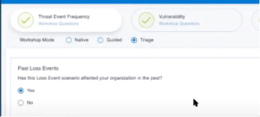 Triage
Using the Triage workshop mode for data gathering allowed us to quickly make estimates of Frequency. This was especially useful for the VPN overload scenario, where organizations were often able to reference events that occurred in the past.
Loss Tables
The Data Helper inputs, combined with loss tables tailored to historical data on PII data breaches helped to ensure the defensibility of inputs in the process of generating results. We were able to leverage this reusable information for secondary loss magnitude inputs such as: Fines & Judgments, Response Efforts, and Credit Monitoring.
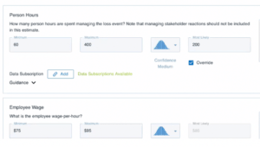 Data Helpers
Pre-defined data helpers helped us to consistently and efficiently enter inputs in the RiskLens platform on the magnitude side of the model. In the example above, the organization would not have known where to start without data helpers. We were able to leverage data helpers to answer multiple "Guided" questions in the RiskLens platform such as Person Hours, Employee Wage, Secondary Loss Event Frequency, Loss Event Detection, Loss Event Recognition, and Sensitive Records.
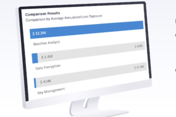
Risk Analysis Results
You might be wondering about the results from such a fast and easy process. Were they accurate? Were they defensible? By using wide ranges to account for uncertainty on the frequency side of the model, and leveraging pre-built Data Helpers and Loss Tables for the magnitude side of the model, we can be confident that our results are accurate with a useful level of precision. On top of that, the RiskLens platform prompts us to enter rationale for each input. In the face of skepticism, we were always able to revisit our assumptions and defend our results.
No matter where you are in your FAIR journey, whether you have lots of data or you think don't have any at all, RiskLens can meet you where you are and provide meaningful results.