
As a board member or executive leader, you have to know the fundamentals of effective risk management. One graphic contains the knowledge you need.
Heat maps, bow-tie diagrams, tornado charts — the world is filled with charts and infographics about risk management, some of them valuable and others ...not so much. But my favorite graphic, and the one that I think teaches people the most about good risk management methods, isn’t built in Excel, R, a GRC tool, or any other fancy software package. While it demonstrates the necessity of quantitative risk management, it doesn’t even involve any numbers! It’s a simple set of text boxes that, once understood, opens the door to the kind of risk management program we are all striving to build:
 Effective Risk Management
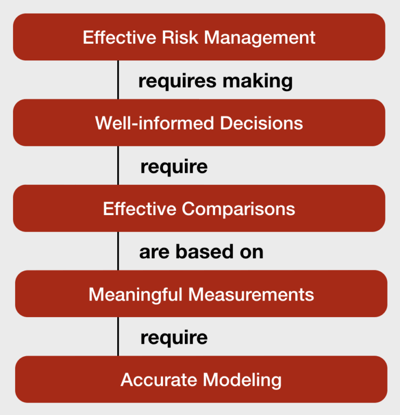
Let's start at the top of the diagram. “Effective Risk Management" is the goal of any risk management program, but what does it mean? Effective risk management is the set of processes that results in the most cost-effective limiting of future losses to within an organization’s risk tolerances. Put more simply, risk management is effective when it keeps losses at an acceptable level as inexpensively as possible.
Well-Informed Decisions
In order to manage future losses — indeed, to manage anything — an organization has to make a number of well-informed decisions. It has to decide which risk scenarios to mitigate, accept, transfer, or avoid. It has to decide which mitigation strategies will most cost-effectively limit future losses. It has to decide how much risk transference to obtain through insurance policies, etc. If the organization doesn’t get these decisions right, it cannot effectively manage risk.
Effective Comparisons
In order to get those decisions right, the organization needs to be able to draw effective comparisons between options. It needs to be able to compare the risk associated with two different scenarios to understand which is more important to tackle. It needs to be able to compare the risk reduction and costs associated with two or more different mitigation strategies to decide which option to implement. If the organization can’t make these comparisons, it can’t make well-informed decisions and therefore can’t effectively manage risk.
Meaningful Measurements
Comparing requires measurement. I don’t know which road is longer unless I measure them both in a common unit like miles or kilometers. Similarly, an organization can’t know which risk scenario is scarier until it measures the risk associated with each one in a meaningful way. It’s at this measurement stage that most risk management functions get it wrong.
Comparing scenarios based on subjective “high, medium, low” ratings isn’t meaningful measurement — how can you be sure those terms are applied consistently across analysts? How do you know what “medium” really means? Are all of the scenarios in the “very high” section of the heat map equally scary? How red is “red?” Even if you sign off on definitions for each of those ratings, they are likely filled with squishy terms like “significant” or “considerable.” We don’t slap “high, medium, low” labels on financial statements like revenue projections, so why do we continue to accept those labels when it comes to managing risk? Instead of trying to decipher layers of subjective language open to individual interpretation, let’s try talking about risk the way we actually experience it: in money lost in the future.
The meaningful measurement of risk from a given scenario is the forecasted range of probable loss the organization will experience from that scenario over a given time-frame. This forecasted range is expressed in dollars (or other relevant currency) and is derived from estimates of how many times the bad thing might happen and how much money it might cost us each time it does. We call these factors of risk loss event frequency and loss magnitude, respectively.
These forecasted ranges are meaningful because they’re in the same unit in which we experience loss, and because they don’t fall prey to the potential misunderstandings and lack of clarity we get when we use subjective qualitative labels like “medium risk.” We may not agree on what “medium risk” means, but we know exactly what it means when we hear “we forecast losses of between $200,000 and $800,000 with a most likely value of $450,000 over the next year.” Forecasting future losses in dollars provides the meaningful measurement on which comparisons can be made, enabling well-informed decisions and, ultimately, effective risk management.
Accurate Risk Modeling (FAIR)
That brings us to the last element of the graphic. In order to generate meaningful measurements of future losses from a given scenario, we must have a consistent and repeatable process and framework for measuring risk. Those ranges of forecasted loss won’t be acceptable for comparison if they weren’t created using consistent, rigorous, and logically defensible methods. A quantitative risk analysis process that leverages the FAIR model and methodology provides meaningful measurements of risk that can be compared, resulting in well-informed decisions and effective risk management.
A RiskLens Loss Exposure Report:

Managing Risk Should Be Like Managing the Rest of the Business
Managing revenue from a line of products (maximizing it while limiting costs) requires well-informed decisions about materials and sourcing, manufacturing processes, distribution networks, and many other topics. Choosing between all the alternatives involved in those decisions requires effective comparisons of their impact on revenue. Those comparisons can only be made if we can meaningfully measure forecasted revenue using accurate modeling that predicts revenue based on number of units sold at a given price, cost per unit, etc.
Managing risk is no different, yet the majority of risk management practitioners continue to falter when it comes to making meaningful measurements of risk, ultimately hindering their organization’s ability to effectively manage risk. With the FAIR model and the software and services provided by RiskLens you can leverage accurate modeling of risk scenarios and harness the value it provides all the way to the top of the chain — truly effective risk management.
Are your attempts to effectively manage risk being thwarted by “high, medium, low” labels or other qualitative approaches? The experts at RiskLens can help transform your organization’s risk management practices. Contact us today.