
Get a good look in this video at how the RiskLens platform makes cyber risk quantification fast, easy to understand and easy to do. It’s aimed at ServiceNow clients but open to anyone curious about how RiskLens turns Factor Analysis of Information Risk (FAIR™), the standard for cyber risk quantification, into an everyday support tool for business decision-making.
Watch the ServiceNow video webinar: Ask the Expert: Risk Quantification Just Got Better with New RiskLens/GRC Integration, led by Cary Wise, Head of Partner Professional Services for RiskLens.
The RiskLens platform launches for ServiceNow clients with one click from any risk entered into the Governance, Risk, and Compliance (GRC) Risk Management application. Features and capabilities include:
- Rapid Risk Assessments, completing in 15-30 minutes what typically takes weeks in conventional risk analysis
- Guided workflow, with a simple question/answer interface
- Data libraries and industry data for quick plug and play of data for analysis
- Automated, Monte Carlo analysis, producing flexible reporting showing ranges of probable outcomes for loss exposure in dollar terms. As you’ll see in the video, reports are highly visual – and changeable on the fly to answer what-if questions.
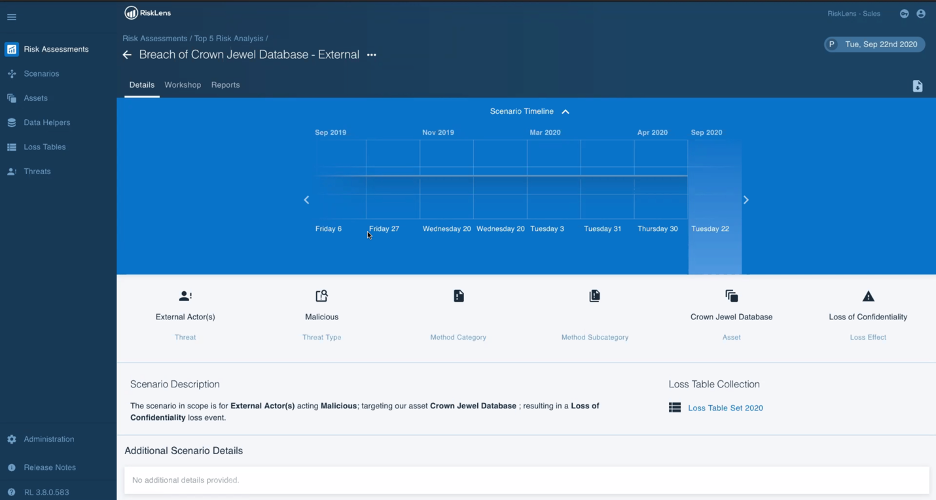
The starting point for successful quantitative risk analysis is a well-formed risk scenario and the platform walks the user through filling in each of the scenario elements.
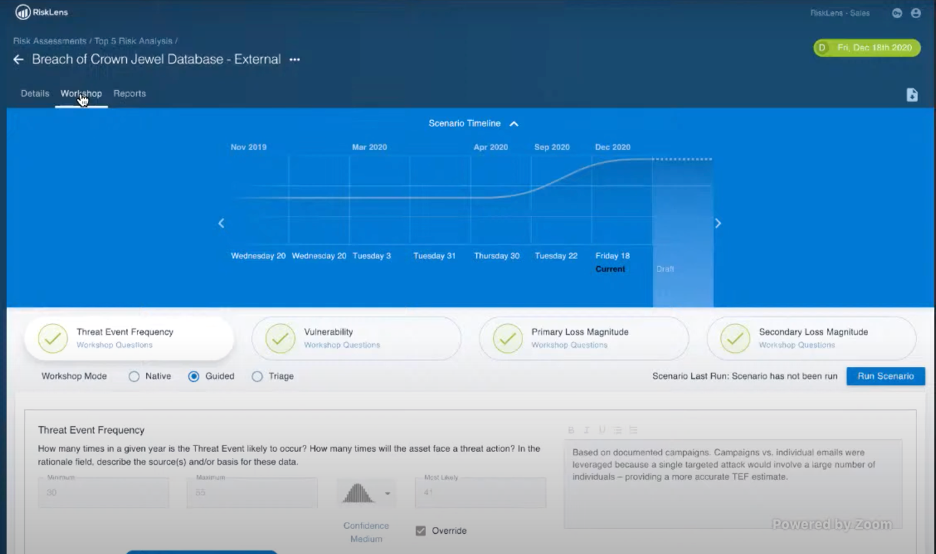
The platform also guides filling in the data for the key elements of FAIR analysis, Loss Event Frequency and Loss Magnitude.
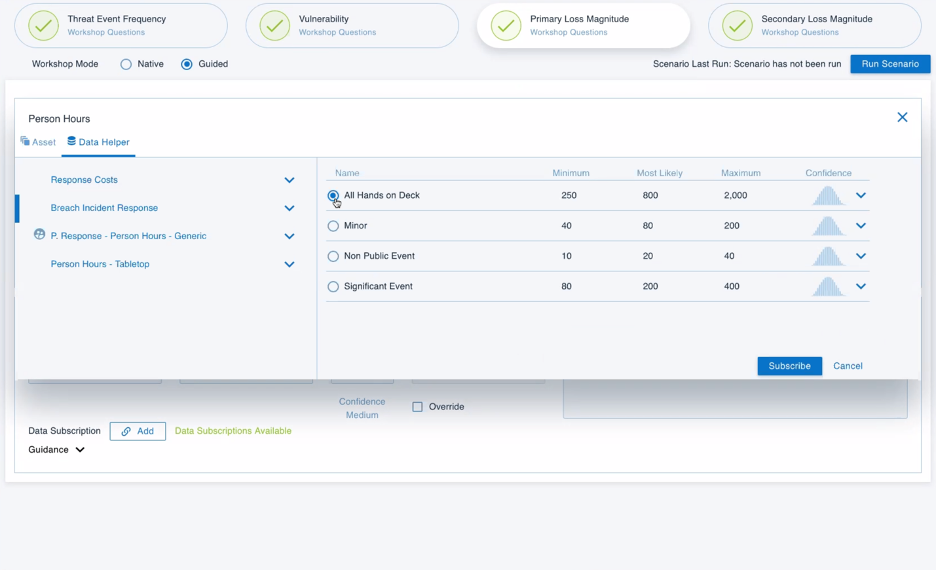
For instance, for Loss Magnitude, the platform draws on pre-populated Data Helpers – in this view, with the person-hours that the organization expects should be costed-in for an all-hands-on-deck response to the breach of a crown jewel database.
 Choosing the Triage function in the platform guides users through quick, high-level risk analyses.
And that’s where Cary Wise recommended that ServiceNow clients first start with quantification. “If you want to know how much risk you have, you need to know what risk you have,” he said. Take the risks of most concern from the risk register and run them through Triage analyses. Then use the aggregation capability of the platform to prioritize them by loss exposure.
.png?width=936&name=RiskLens-Platform-Top-Risks-Report-2%20(1).png)
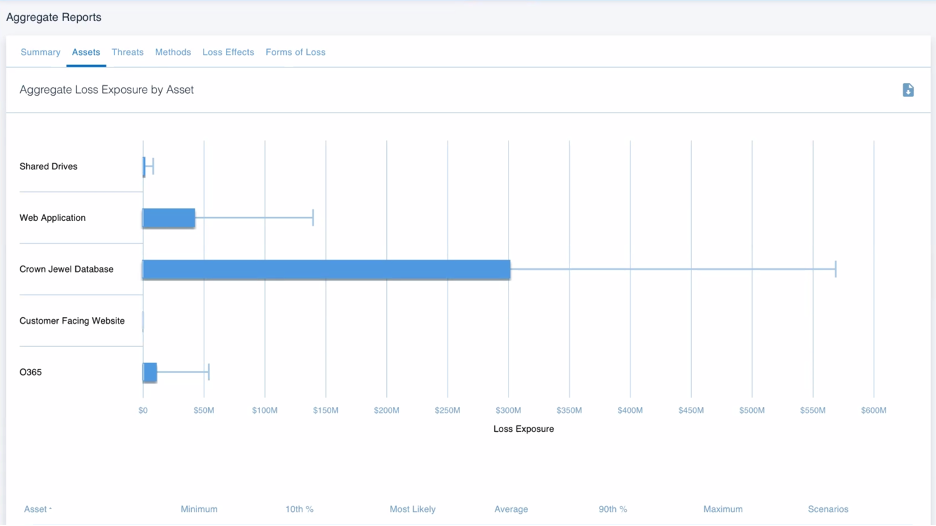
Analysis can also drill down in the aggregate results to see, for instance, which threat communities or asset types pose the greatest probable loss exposure to the organization, very relevant insight for a CISO deciding on how and where to target defenses.
With analysis complete, the results are automatically populated in the ServiceNow GRC risk register, where they can be compared against risks from across the enterprise – and displayed in reporting already familiar to the organization, such as heat maps.
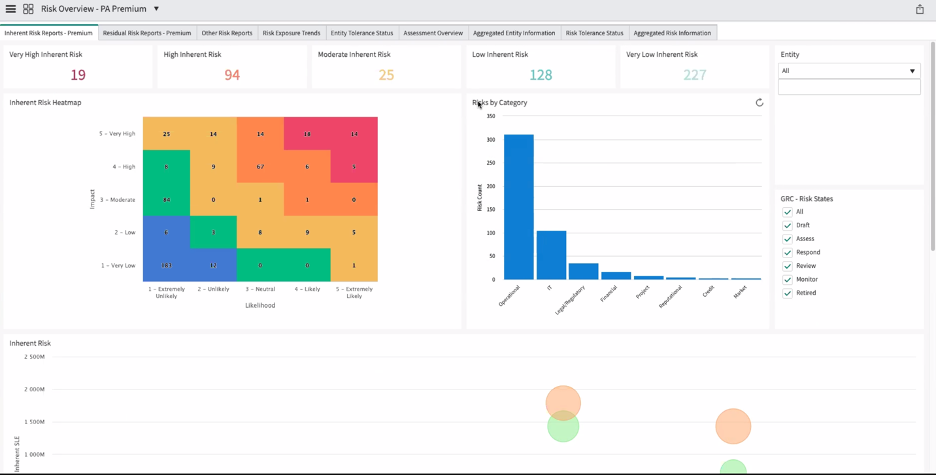
For ServiceNow clients wondering “how do we make the shift towards quantification,” Cary said “I recommend supplementing the way you are currently reporting. If you are currently reporting qualitatively, using heat maps or scoring, I would start doing these analyses and supplementing with that.”
The RiskLens/ServiceNow integration is available now at no charge in the ServiceNow customer store.
Watch the ServiceNow video webinar: Ask the Expert: Risk Quantification Just Got Better with New RiskLens/GRC Integration, led by Cary Wise, Head of Partner Professional Services for RiskLens.