
We usually hear the following amongst new FAIR practitioners, or those that have only conducted qualitative risk assessments:
“I simply do not have enough data to conduct a quantitative analysis.”
These individuals believe in order to conduct a quantitative analysis, it requires an endless stream of highly complex data that can only be crunched and made recognizable by overpriced and unnecessarily complicated algorithms. There are competitors to RiskLens/or companies out there that will make this seem like the case, but it's simply not so.
One great thing I learned when I was introduced to FAIR was the simple concept outlined by Douglas Hubbard in his seminal book, How to Measure Anything:
- You have more data than you think you have.
- You need less of it than you may assume.
Many people new to this process, risk analysts included, get caught up with where to start. When presented with a question that I don’t have a clear and decisive answer for, I work through the following:
Start with an absurd range
By starting with an absurd range I reduce my chances of “anchoring” my estimates to a preconceived, or biased answer. In this fashion, I open my perspectives to previously unconsidered answers.
Reference what I know
What do I know about the question or subject posed that will allow me to dial in the distribution and gain precision in my estimate? It is very rare that I can’t reference some previous experience or piece of external data that will help me with my distribution.
The law of diminishing returns dictates how much effort and resources should be expended in our efforts to gain greater and greater precision in our inputs
I always keep in mind that we are looking for accuracy with a useful degree of precision when it comes to our estimates. Gaining a good, accurate estimate is often better time spent than the additional hours of training to gain marginal precision (i.e. you need less data than you may assume).
The End Result - Risk Expressed as a Range 
In addition to the concepts outlined above, the FAIR model serves as a roadmap to the subject matter experts (SMEs) within your organization that possess many of the data points elicited in an analysis. Who within your organization will know how many attacks you're experiencing in a given year? Possibly your SOC or Incident Response department. Who within your organization will know the strength of your controls environment? Possibly those who conduct the penetration testing for the organization. Who within your organization knows the anticipated revenue impact from a core application outage? Possibly a member of the business. All of these questions are nodes within the FAIR model that require answers. Your job as an analyst is to just go out and find them.
As a RiskLens/FAIR analyst, I use these concepts every day. Whether it be in our training sessions, or onsite with our customers, it hasn’t failed me yet.
Learn more from Douglas Hubbard on How Much Data You Need (or Don't) for Cyber Risk Analysis
How many times have you heard the complaint: We have lots of uncertainty around risk - so we need lots of data. "Mathematically, the opposite is true!" Doug says, Watch this short video excerpt from Doug's speech to the 2019 FAIR Conference and learn how less can be more when it comes to data for cyber risk analysis. (You can see the complete video on the FAIR Institute website. A free membership in the Institute required.)
TRANSCRIPT
Here’s a way to think about this stuff.
Think about the expected value of information. How much would you be willing to pay if you could eliminate uncertainty about something? Maybe a single variable in a range that you might be modeling in a FAIR taxonomy, maybe one of the impacts or something like this and you have a lot of uncertainty about it?
You could start sampling or measuring something to reduce your uncertainty.
Imagine I plotted on a chart like this a function that describes the value of additional information and the cost of additional information.
Well, at its peak, I would have EVPI, the expected value of perfect information. What’s the theoretical value for measuring something, assuming I could eliminate all uncertainty about it? That’s called EVPI and there’s a way to calculate it. It comes from game theory and decision theory. It’s been around for many decades. 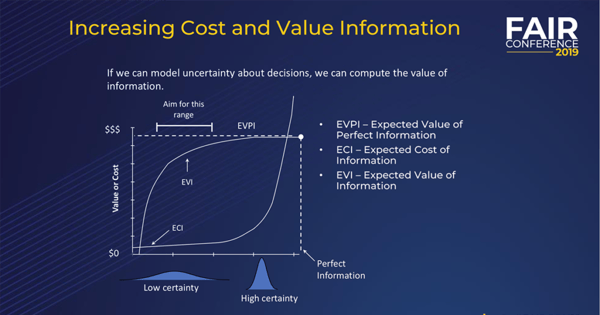
So, as I move forward on the horizontal axis, I get more and more certainty, less uncertainty, until let’s say I could potentially get out to perfect information. My vertical axis is a monetary measure. As I increase my certainty, the expected value of that maxes out at EVPI.
Now, EVI is a function that’s just like EVPI but without perfect. It’s the expected value of information, including partial information. You’ll notice that if you plot it out, if you actually do the calculation on a wide variety of decision problems, it’s concave.
It increases more rapidly at first, then levels off because it can never exceed EVPI. It may be asymptotic to it, it may eventually meet it, but it can’t exceed it.
ECI, on the other hand, is different. It starts out slow but if you want to get rid of that last little bit of uncertainty, it takes you much, much more. So, the cost of information skyrockets, and it doesn’t pay any attention to any barriers about EVPI. You can definitely spend more on information than it’s worth – no one is keeping you from doing that. It’s not rational but you certainly can do that.
So, what does this chart tell us? What can we learn from something like this? One of these is concave and the other is convex. What this means is that the high payoff measurements are going to be relatively early in a measurement.
In fact, it tells us that the more uncertainty you have, the bigger uncertainty reduction you get from the first few observations. So, think of it this way: If you know almost nothing, almost anything will tell you something. That’s what the math actually says.
How many of you have run into situations where there was an assumption that if you had a lot of uncertainty, you needed a lot of data to measure it? We have lots of uncertainty, therefore we need lots of data.
Mathematically speaking, just the opposite is true. The more uncertainty more have, the bigger uncertainty reduction you get from the first observations.