
 Recently, I was working with an agency in the public sector and we were discussing how to best present the results of their analysis in a way that would resonate with their leadership.
In the private sector, it would have been an easier discussion, with the entire organization focused on the bottom line and speaking the common language of results in financial terms--why FAIR™ analysis for quantitative risk is so popular for corporate risk management.
But how do you analyze risk exposure and identify cost-effective risk management for government agencies when there is no profit motive? I showed my government clients this chart of the risk management stack (see below).
The risk management stack is a logical breakdown of how to enable cost-effective risk management in an organization. The concept is that in order to achieve cost-effective risk management, you need to be able to make well-informed decisions, which require effective comparisons. Those effective comparisons are reliant on meaningful measurements, which require accurate models.
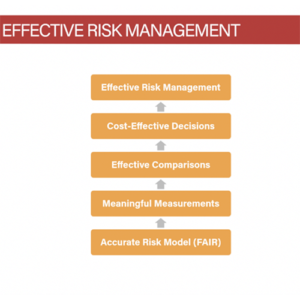 Factor Analysis of Information Risk (FAIR) provides a consistent, rigorous, and logically defensible model that enables meaningful measurements that cost-effective risk management relies upon. The meaningful measurements that result from the FAIR model are in the form of economic values – dollars and cents, which enables decision makers to answer questions such as, “How much risk do we have?” or “What are our top risks?”.
Another benefit of using economic value as a measurement is the ability to draw comparisons to things that matter most to stakeholders. I asked my clients what it was that their leadership cared about. The answer was the impact on their annual budget – the total pool of resources for all activities for the year, and their ability to meet mission objectives.
The annual budget comparison is pretty straightforward. If you are given $X total funds for the year and are forced to spend $Y in response to an event occurring, then you only have $X-Y remaining for mission objectives. As an example, if the agency’s total annual budget is $8M and annualized loss exposure is expected to be between $800K - $2M, then that exposure can be communicated as 10% - 25% of the total annual budget.
While the ability to meet mission objectives might sound ambiguous, it is ultimately driven by the productivity of the employees in the organization. Less distractions means more productivity means more missions completed. More distractions means less productivity means less missions completed. Based on this, we determined that for them, mission objectives could be communicated in terms of FTE hours.
To that end, we also included the total FTE hours expected as a result of the event in the reporting as well. Because the majority of the losses associated with the event were based on employee activities in response to the event, we were able to divide the total loss exposure by the weighted hourly FTE value. Using the same example as above, if we assume the weighted hourly FTE value is $100, we can then communicate the exposure as approximately 8K – 20K FTE hours.
While communicating in economic value enables the ability to make cost-effective decisions related to the limited resources an organization has available, it has the additional benefit of being easily comparable to other key drivers.
One of my favorite quotes by Douglas Hubbard, author of How to Measure Anything, goes something like this “if it matters, it can be observed. If it can be observed, it can be measured.” While your organization may not care about revenue--if what they do care about matters, then it can be measured, which means you’re well on your way to making effective comparisons and enabling cost-effective risk management.