
 As we’ve seen in the ransomware attacks on Colonial Pipeline, JBS USA meatpacker, hospitals and too many more, a cyber attack can be like heart attack for an organization, effectively shutting down business for a painful length of time. Organizations need to identify and understand on a deep level their top risks in cybersecurity to plan for worst-case scenarios.
Erin Macuga is a Risk Consultant for RiskLens
A RiskLens Top Risk Assessment enables detailed analysis of just these sorts of potentially material risks. Here’s how it works, using the RiskLens platform for cyber risk quantification:
Start with a Rapid Risk Assessment to Identify Top Risks
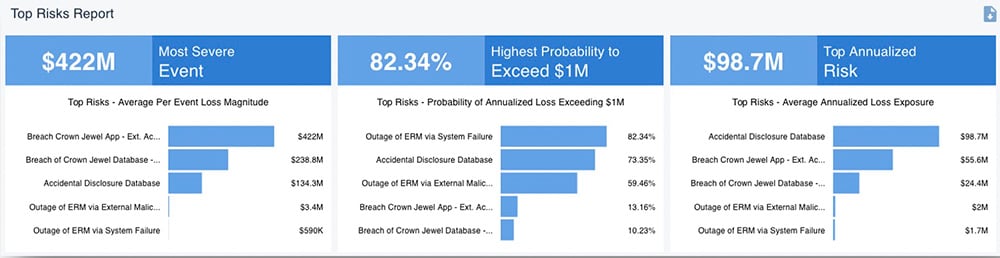
Through a Rapid Risk Assessment on the platform, an organization can quickly analyze a group of cyber loss event scenarios surrounding a specific theme (cloud security, insider threats, access management, etc.), an asset (crown jewel database, network shared drives, a customer facing application, etc.), or across a product area or the entire enterprise, determine the probable frequency and impact of the cyber loss event – and see which scenarios bubble up to the top for as top risks for loss exposure in dollar terms.
Conduct a Detailed Analysis of the Most Concerning Top Risks
Based on the top risk report from Rapid Risk Assessment, the organization now has a target list for detailed analysis with the RiskLens platform. Let’s take as an example, the risk Database Breached by an External Actor.
Gather Data
The platform features a workshop format, with questions to guide the analyst in data gathering from subject matter experts (SMEs) in the organization. Analysts also have the opportunity to utilize Data Helpers, data storehouses for both the frequency and magnitude sides of FAIR™ analysis, drawn from the organization’s data and industry data, to speed along the data gathering process.
Leverage Pre-defined Scenarios
The platform also features archetypes of pre-defined scenarios, another time-saver. Working with an archetype for a similar or the same scenario to be analyzed, the SME just has to verify the range and knows exactly what data is being requested.
The information in these archetypes and the Data Helpers can then be collected once and reused across multiple scenarios. For example, the number of network footholds per year can be utilized for any network foothold scenario as well as modified to better account for what the SME and the organization see per year.
Example Scenario: Database Breached by External Actor
For the scenario of the database being breached by an external actor, the analyst would be interested in knowing how often an external actor has attempted to breach the database in the past. Then the analyst would want to understand the controls surrounding the database, their vulnerability and how likely an external actor is to not only target the database but if the database would fall victim to infiltration and data extraction by the external actor.
Learn FAIR quantitative risk analysis from experienced risk consultants at RiskLens Academy
Since the analyst is looking at a breach scenario, and will be looking for incident response figures, this is another good place to utilize Data Helpers. For example, the Person Hours and Employee Wage question within the guided workshop questions for Primary Loss are great places to use Data Helpers. The helpers (for instance, for the Person Hours question) can be set up in a tier fashion by the severity of the event or the number of records that could be accessed during the breach.
Finally, the analyst will look at secondary loss effects, understanding if there will be a response from those outside the organization, the number of records that could be stolen from the database, and if there would be fallout from customers who leave the organization due to the breach.
Run the Analysis
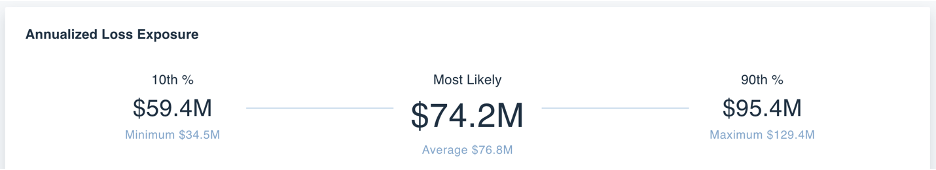
Once the analyst has collected data for all the workshop questions, it’s time to run the scenario to see the results. These results will break down the number of times the event is likely to occur and how much it will cost when it does. In addition, the analyst can see the annualized loss exposure that highlights the range of loss if the event occurs.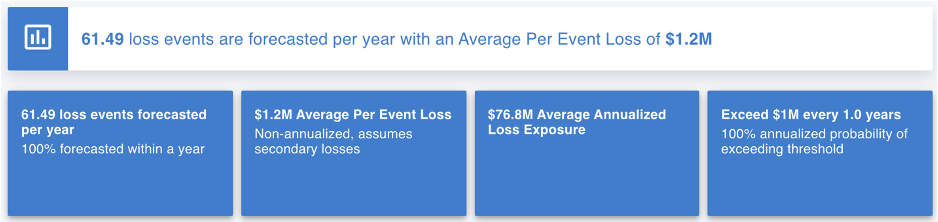
 This scenario can then be aggregated into a risk assessment by itself or with several other scenarios. These additional scenarios should be related to the database scenario that was just analyzed but with a different threat actor; or a scenario that would be within the same theme. Through the aggregation of one of more scenarios, the analyst can see several additional reporting options (broken down by asset, threat actor, effect, method, and form of loss) and the aggregate annualized loss exposure.
Risk Treatment Analysis to Compare Mitigations
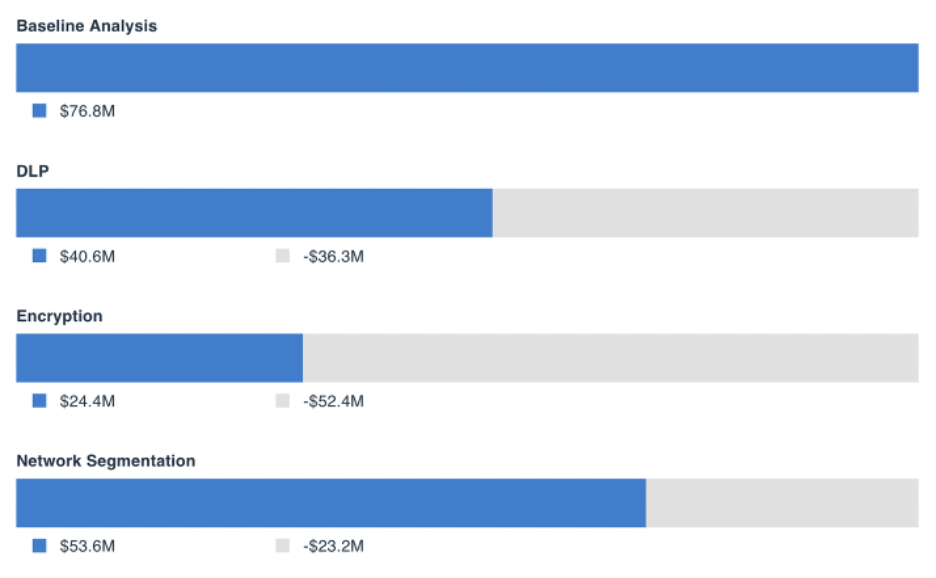
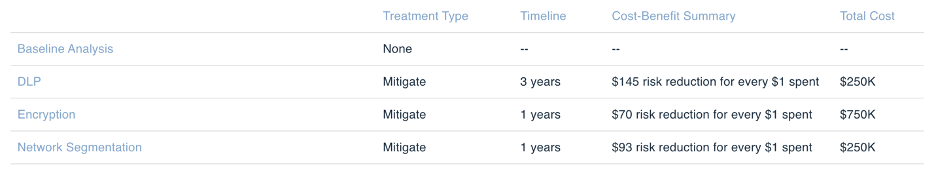
Once the risk assessment has been completed, the analyst can go use the platform’s Risk Treatment Analysis capability to compare the risk reduction of implementing a specific control or highlight which control would provide a more significant risk reduction and a higher return on investment in dollar terms. Following our example above, we add a comparison of implementing a DLP tool to reduce the number of records that could be exfiltrated by an external actor.
The platform also enables the analyst to consider the cost of implementing the new control and the return on investment. This is done by considering the cost of the control, the time spent implementing the new control (testing, setting up, etc.) and training personnel.
The analyst can add comparisons and risk treatments for other tools the organization may be considering implementation for such as encryption and network segmentation. Once we run the comparison, we can see how the risk to the organization would be reduced if DLP, encryption, or network segmentation were in place.
 Reporting to Decision-Makers
Once analysts have a complete picture of a particular scenario, they can effectively present the results to their managers so that the managers can make well-informed decisions. By properly conducting the analysis and presenting the detailed analyses results and how implementing or not implementing a control would impact the organization, managers can fully understand where to focus and prioritize the organizations’ resources, time, and effort.
See a RiskLens risk analysis in action - contact us for a demo.