
 My first exposure to risk burndown reports was decades ago when assessing cumulative risk against projects. I remember the risk burndown chart illustrating the effects of multiple risk scenarios on project completion.
At the time I remember people using “gut feel” to determine the probability of risk scenarios impacting the completion of the project, e.g., Risk A has a 30% probability of becoming an issue, while Risk B only a 10% probability. Imagine dozens of risk scenarios, all being off by 10%. Consequently, due to the subjective nature of the overall risk assessment, the risk burndown graphs were never accurate and project productivity expectations were almost always missed.
Fast forward to 2021. Lately I have been listening to risk executives talk about risk burndown plans, specifically related to cybersecurity and technology risk management, and some of them asked me to draw up concepts for an accurate burndown chart. My first thought was to not repeat the subjective risk management sins of the past!
Steven Tabacek is Co-Founder and Managing Director, Customer Experience, at RiskLens
After many years of risk quantification with FAIR™ (Factor Analysis of Information Risk), here are my thoughts on an effective, objective approach to cybersecurity/technology risk burndown, and a sample burndown report:
Steps to Set Up Your Burndown Analysis
1. Ensure the risk assessment is objective using a proven model (FAIR, the basis of the RiskLens platform).
2. Identify and properly scope risk scenarios which potentially impact the productive nature of each line of business. Start with a well-defined asset, threat, and loss effect (e.g., confidentiality, integrity, availability). The RiskLens platform guides you through the scoping process in workshop question format, drawing on asset and threat libraries, loss tables and data helpers.
Read: Starting Off on the Right Foot: How to Clearly Define a Risk Scenario Statement for FAIR Analysis.
3. For each risk scenario, ensure mitigation activities are clearly defined, objective, and have specific measurable outcomes.
4. To recognize risk burndown over time, record each baseline risk scenario and then show timeline progress (risk reduction) as controls or mitigations are applied. Within the RiskLens platform, timeline tracking of each scenario is a default/automated capability.
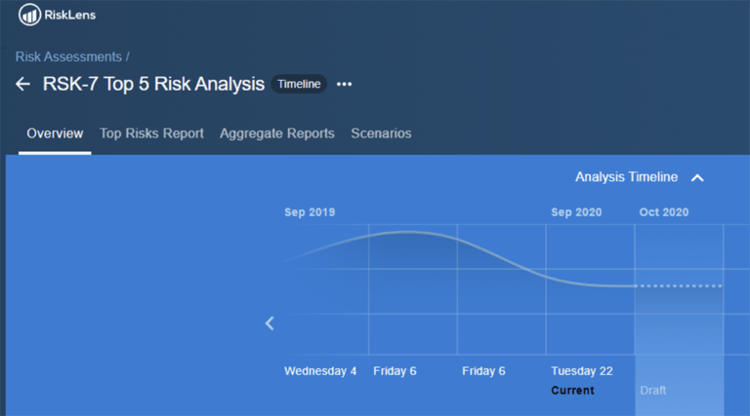
Risk scenario timeline from the RiskLens platform
5. Using RiskLens, it is easy to model both effectiveness and ROI of mitigation options with the Risk Treatment capability.
6. Establish a timeline for control/mitigation implementations. Set quarterly OKR’s for control teams to implement mitigating controls having the greatest reduction on annualized loss exposure.
7. Quarterly and annually chart the relationship of risk mitigation activities, plotting risk level versus their relative risk burndown/reduction contribution.
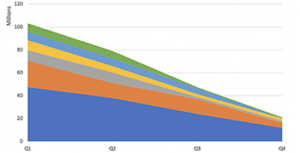
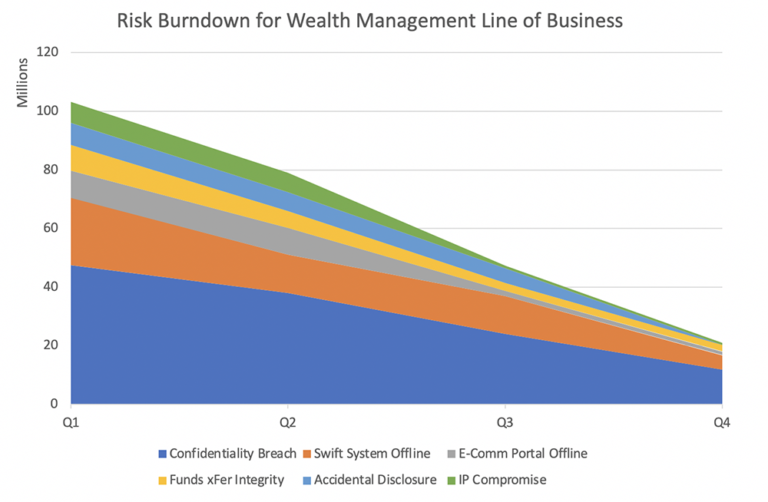
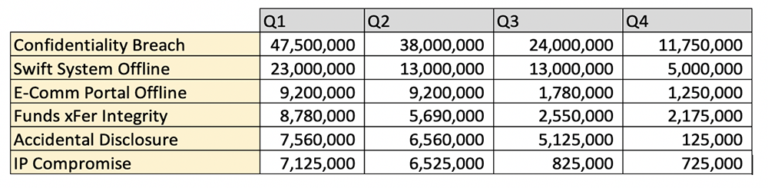
Creating the Cyber Risk Burndown Graph with Data from RiskLens Platform Analyses
Your initial risk burndown chart should represent scenario and aggregate current risk, and then forecast burndown based on mitigation application.
The inputs driving the chart are quite simple:
- Each color represents a scenario.
- Timeline selected is quarterly, Q1, Q2, etc.
- The loss exposure in this case simulates ALE.
- End of each quarter the assessment should be run, marked as Complete, then the ALE number represented on the Assessment timeline can be used.
Reporting on Risk Burndown to Senior Management
Executive stakeholders will want to know what the risk scenarios are, how much risk ($) does each represent, what is the plan to mitigate, and finally in the end, can we show cost-effective risk reduction. Illustrating this with a risk burndown chart is an effective way of communicating the effectiveness of risk management efforts towards ensuring organization productivity and/or profitability.