
We’re into continuous improvement based on user feedback around here, and the latest iterations from our product workshop are all about adding the flexibility we know customers want to fine tune their analyses for the sharpest possible picture of cyber risk. Here are some of the latest features for the RiskLens quantitative analysis platform: 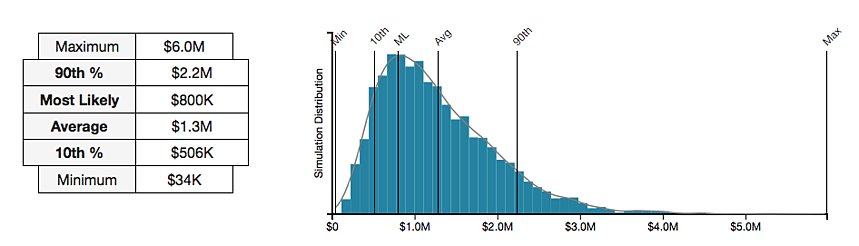
‘Most Likely’ Calculations Added to Results
The RiskLens computational engine uses Monte Carlo simulations to calculate a range of probable outcomes for a given scenario; results are in dollars (or your currency of choice) for loss exposure, annualized. The report offers six cuts— now including "Most Likely"-- so decision-makers have a wide range of choices, based on their cyber risk appetite.
- The largest result in the set outcomes, AKA “worst case”.
- Upper Percentile. Typically set at 90th -- meaning 90% of the result set outcomes were below this point—but adjustable to 75, 80, 85, etc. A more risk-averse organization might find its comfort level here.
- Most Likely. This new addition really kicks up the usefulness of the reports, as it’s an easy concept for decision makers to grasp. Most Likely is an estimation of the mode (the number which appears most often in a set of numbers) that we derive by using a sophisticated technique called Half-Range Estimation.
- Average. The mean (sum of all results divided by the total number of results) – useful but can be skewed by long-tails in the distribution of the results.
- Lower Percentile. Often set at 10th , the loss exposure value where 10% of the results are below it. Can be set to 5, 15, 20, etc.
- Min. Smallest result.
Sensitivity Analysis Adds Negative Testing to Show Potential Hotspots
The RiskLens platform doesn’t just show Max, Most Likely, etc. outcomes for probable risk. The Sensitivity Analysis function also empowers you to game out what-if scenarios to view the potential effects on loss exposure of adding more or different defenses. That’s a very useful tool for targeting investment in cybersecurity controls for best ROI. Sensitivity Analysis already had positive testing, i.e. what happens if you increase a control or if threat events decrease in frequency.
Now, we've added negative testing all owing you to turn the dials in the opposite direction, so to speak: What happens if a control is retired or if its efficacy decreases, if threat capability of attackers increases, or if you add more affected users, for instance. You can now identify which factors are now doing the most to hold down risk and could turn into hotspots if they degraded. As the threat landscape changes from day to day, this will give you a feel for what areas might be most at risk.
And more…
The RiskLens platform also added better integration with GRC tools – in fact, more than 40 improvements are in the latest release of the product, as we continue to innovate more ways for you to explore risk analysis and identify more opportunities to lower loss exposure.