
 The COVID-19 pandemic has forced businesses around the world to adopt a remote model or close up shop indefinitely. This sudden and unexpected change to a remote workforce has challenged businesses to find new ways to collaborate and share information. While the applications and programs may vary, they all hold one thing in common: the cloud.
Pandemic or not, the reality is that cyber security risk does not vanish or diminish in the wake of a global health crisis. In fact, many would argue the opposite is true. Among other things, the sudden move to cloud hosted solutions has likely impacted your cyber risk exposure. Using RiskLens and the Factor Analysis of Information Risk (FAIR) model, you can determine just how much that change impacts your bottom line.
To understand the change in risk exposure, you will need to analyze the risk you face from relevant scenarios, first assuming the asset is stored on-prem, and then that it is cloud hosted.
There are many risk scenarios that would be relevant in this situation. I would recommend selecting the 3-5 that are most probable to analyze to get a “big picture” idea of the total loss exposure. If you’re balking at the amount of work required, don’t worry - by using the Triage capability of the RiskLens platform, you could have your selected scenarios analyzed in the span of your lunch hour.
For the purposes of this exercise, we will focus on the following scenario:
How much risk is associated with a confidentiality breach (effect) of sensitive information contained in XYZ database (asset) by malicious external actors (threat)?
Step 1: What’s your exposure now? (on-prem)
In order to understand your current loss exposure associated with a breach of sensitive information in the XYZ database, you need to understand two things: how often a breach of sensitive information contained in XYZ database will occur (in FAIR terms, Loss Event Frequency) and the financial loss exposure each time it does ( Loss Magnitude).
Loss Event Frequency
Depending on the information you have, you may choose to go down a step further and evaluate the components that Loss Event Frequency is made up of: how often an external malicious actor will attempt to breach the sensitive information in XYZ database ( Threat Event Frequency) and the probability an attempt will be successful ( Vulnerability).
Assuming that this event has not happened in the organization before, consider whether that is because it simply has not been attempted (think value of the information, the visibility of the organization itself, how publicly known the database is, etc.) or because it has not been successful due to the controls/processes in place?
Loss Magnitude
Loss Magnitude is broken down into two main components; Primary and Secondary, which are comprised of six forms of loss: response, replacement, productivity, competitive advantage, reputation, and fines and judgments. For each scenario you must determine which of the six would be applicable. For a database breach, I would expect the following: response (primary), response (secondary), fines and judgments (secondary), and reputation (secondary). Learn more about capturing Loss Magnitude. 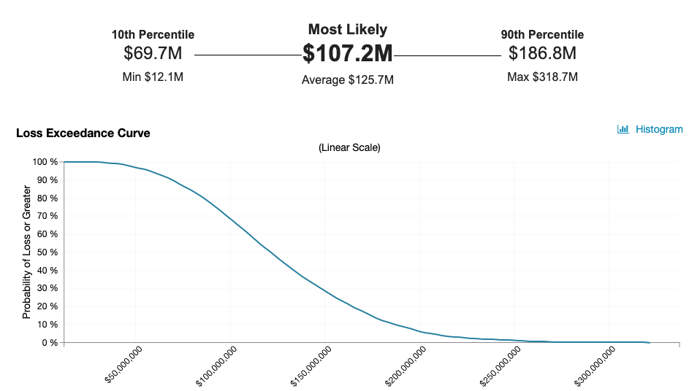
The chart above shows the likelihood of specific annual financial loss exposure (Annualized Loss Exposure) or more occurring per year. In this example, there is about a 62% likelihood of $107.2M or greater of loss exposure occurring in a given year.
Step 2: What will your exposure be when you are cloud-hosted?
To estimate how much risk you will face after having migrated to a cloud-hosted solution, you must first determine which main component will be affected by the change:
- How often the event is attempted (Threat Event Frequency)
- How often the event is successful (Vulnerability)
- How bad it will be if it occurs (Loss Magnitude)
Typically, only one of these areas is materially impacted but it can vary by organization. Once you identify which components are affected, you can then estimate the extent of that effect. For example, you may determine that the migration to the cloud would result in a 20% decrease in Vulnerability due to increased perimeter controls and improved patching cadence with your cloud provider.
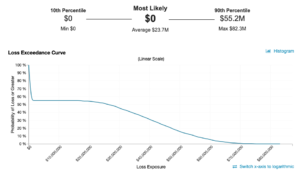
In the future state with a cloud hosted solution, there is now a most likely Annualized Loss Exposure of $0. This means that in the majority of simulated years (in this case 5,000 using the RiskLens platform to run Monte Carlo simulation with standard iterations) the loss event did not occur, meaning there was $0 of loss exposure. This is typically as a result of a low frequency (less than one time per year), a low vulnerability, or both. In this case it was a combination of both that drove this result.
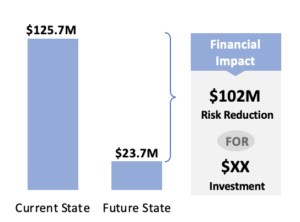
Step 3: What’s the difference?
After you have an understanding of the amount of risk you face from a breach of sensitive data in XYZ database when considering both an on-prem (current state) or cloud-hosted (future state) solution, the last step is to evaluate ROI.
The comparison chart shows that there is approximately $102M decrease in average Annualized Loss Exposure as a result of migrating to the cloud hosted solution. The next step would be for the organization to determine the amount of financial investment (both capital and FTE) required for the migration in order to calculate the return on investment (ROI).
The ongoing debate of whether cloud hosted solutions pose more or less risk is not a black and white issue. The next time your organization considers moving or standing up new systems in the cloud, ensure a comprehensive quantitative risk assessment is part of the decision-making