
 Recently, I worked with a company in the media industry that was interested in a quantitative cyber risk assessment of their current risk related to a web application attack aimed at exfiltrating customer PII from an internal database.
The company was considering several control investments to mitigate their risk, including an internal or cloud migration of the underlying web application server.
Let's walk through the analysis as well as the key takeaways the organization was able to uncover.
Scoping
The first step in a quantitative cyber risk analysis is to scope the loss event. There are three main components to a properly scoped loss event: asset, threat, and effect. It is also beneficial to include the vector the threat will utilize.
The loss event for this scenario is: The risk associated with a cyber criminal (threat) launching a web application attack (vector) and exfiltrating customer PII contained in the main customer database (asset),resulting in confidentiality loss (effect).
In addition to the current state loss event (above), we also completed an iterative analysis in which we assessed the overall change in risk exposure if the customer PII was a) migrated to a more secure internal area of the environment or b) migrated to the cloud and purged of stale data. This involves isolating the specific components of the model that would be impacted by the control change and adjusting accordingly.
Data Gathering
After the analysis had been scoped, the next step was to gather the data. Utilizing historical values as well as the input of SMEs, we determined estimates related to each of the components of the FAIR model.
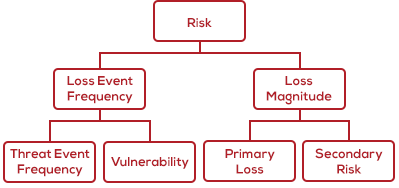 Starting on the left side of the model, we estimated the Loss Event Frequency of the event. In order to do so, we considered the IT environment surrounding the application and underlying database and the types of threat activity that has been seen on the network to determine the Threat Event Frequency. Additionally, we considered the control environment and relative hardening of the asset to determine the Vulnerability of the asset to attack. By doing so, we estimated how often a cyber criminal would attempt to launch a web application attack (Threat Event Frequency) and what percentage of those attempts would be successful in exfiltrating customer PII (Vulnerability).
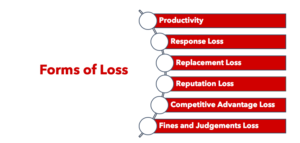
After determining how often we expected the loss event to occur, we then estimated the likely impact to the organization in economic terms. In order to so, we considered the six forms of loss in the FAIR methodology and determined which would be applicable to the scenario.
Included below are the forms of loss that were considered relevant for this scenario:
- Response Loss (Primary) – represents the loss associated with the internal incident response efforts related to the event.
- Response Loss (Secondary) – represents the loss associated with responding to the “fallout" of the event
- Regulatory Notification – represents the loss associated with notifying regulators of the event as well as responding to their requests. This is the level of effort involved from legal and compliance staff to determine the regulatory entities that require notification and the states in which they reside.
- Customer Notification – represents the loss associated with notifying customers of the event as well as an influx in calls as a result of the event.
- Fines and Judgements - represents the fines and penalties levied by regulators as a result of the event
- Reputation Loss – represents loss associated with customers taking their business elsewhere as a result of the loss event. Estimated by determining the number or percentage of customers likely to leave as well as the value of those customers
Running the Risk Quantification Analysis
Utilizing the RiskLens Cyber Risk Quantification (CRQ) platform and the estimates referenced above, we conducted a quantitative risk analysis to determine the current loss exposure. After finalizing the current state analysis, we then used the versioning capability in the RiskLens CRQ platform to run an iterative “what if” analysis related to each of the proposed control investments.
To do so, we considered which areas of the model would most likely be impacted by each of the proposed control investments. For the scenario of migrating to a more secure internal area, we determined it was most likely to affect the Threat Event Frequency of the event as it would add an additional layer of security prior to the cyber criminal being able to launch an attack against the data. Additionally, it would affect the Vulnerability as it would reduce the likelihood of certain forms of attack being successful.
For the second scenario of migrating to the cloud and purging stale data, we determined it was most likely to affect the Threat Event Frequency, Vulnerability, and Loss Magnitude of the event. This is because it would add an additional layer of security reducing attack attempt frequency, add additional controls hardening the asset and reducing Vulnerability, and also reduce the overall number of records contained in the underlying database, thus reducing the Loss Magnitude
Analysis Results
The results of the analysis are shown in the graph below. The bars represent the average annualized loss exposure for the analysis. The current state (blue) shows an average annualized loss exposure of 13 million. Additionally, based on the iterative analyses, we noted a risk reduction of $5.1 million as a result of migrating the PII to a more secure internal area of the environment (yellow) and a risk reduction of $10.9 million on average (green) as a result of migrating the PII to the cloud. 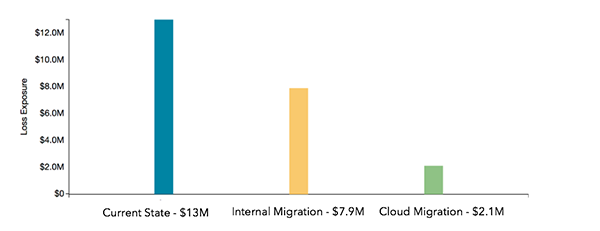
Prior to conducting the analysis, the organization was facing difficulty determining the best course of action related to where and how to store its customer PII.
Based on the results of the analysis, the organization was able to compare the overall risk reduction of each of the control investments to the capital investment required to implement the control in order to determine the best course of action to mitigate the risk related to this scenario.
By doing so, my clients could make an informed, defensible, risk-based decision related to their control investment. They also joined a movement:
- An estimated 30% of the Fortune 100 companies now use FAIR for cyber, technology and operational risk analysis.
- 3,000-plus risk management professionals are members of the FAIR Institute, sharing knowledge about risk quantification.
- Regulatory agencies such as the Securities and Exchange Commission (SEC) and the New York State Department of Financial Services are increasingly demanding risk disclosure in quantified, financial terms.
- Gartner recommends cyber risk quantification as a must-have for integrated risk management.
I encourage you to join them! Contact RiskLens to learn more.