
 NIST CSF, ISO 2700X, and other standards say that cybersecurity risk and its contributing factors can be assessed in a variety of ways, including "quantitatively" or "qualitatively." But what's the difference? Which is the better form of risk measurement for your organization? Why would you conduct a qualitative versus a quantitative risk analysis?
Let's explore the differences between quantitative and qualitative risk analysis.
RiskLens is the leader in cyber risk quantification.
Qualitative Risk Analysis
Analysts use ordinal rating scales (1 - 5) or assign relative ratings (high, medium, low or red, yellow, green) to plot various risks on a heat map with Loss Event Frequency (or Likelihood) on one axis and Loss Severity (or Magnitude or Impact) on the other.
But how do analysts decide where to place the risks relative to each other? They decide based on their experience in risk management or — as Jack Jones writes in his book Measuring and Managing Information Risk: A FAIR Approach — their "mental models." In other words, these decisions are made based solely on the opinions of the people conducting the assessment.
Purely qualitative analyses are inherently subjective. This makes prioritizing risks a challenge. How do you determine, for instance, which red risk is the "most red?" Second, there is also no systemic way to account for the accumulation of risk (e.g., does yellow times yellow equal a brighter yellow?). Finally, there is a tendency to gravitate toward the worst-case scenario for Loss Magnitude since analysts are forced to choose a specific value (e.g., red, yellow, green) versus assigning a value along a continuum.
As a result, ratings are subject to bias, poorly defined models, and undefined assumptions.
WHAT SHOULD A RISK MODEL DO?
 “A model is a simplified representation of a more complex reality. It should support analysis by describing how things are related. Common security frameworks are not analytic models because they don’t define relationships, they categorize.
“It must be scenario-based so you are measuring the frequency and magnitude of loss event scenarios. If a model isn’t scenario-based, I don’t see how the results could be legitimate.
“It also should faithfully account for uncertainty using ranges or distributions as inputs and outputs, not as discrete values.
“The rationale for the inputs -- why you chose your data range and so forth -- should be open for examination. If analysis was done and there is no rationale, then you should be leery of the output."
--Jack Jones, creator of the FAIR model
Read more: FAIR vs Proprietary Models
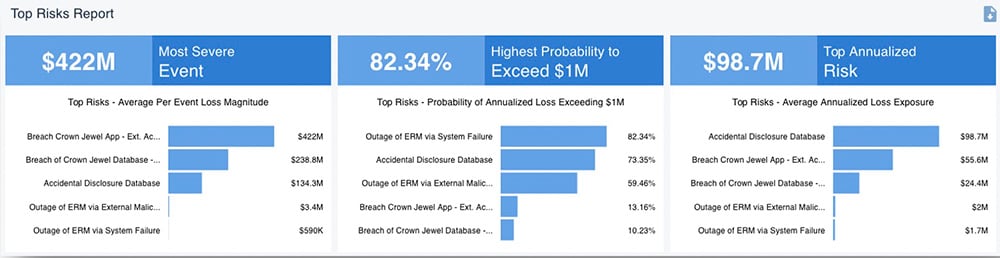 A top risks report from the RiskLens platform
Quantitative Risk Analysis
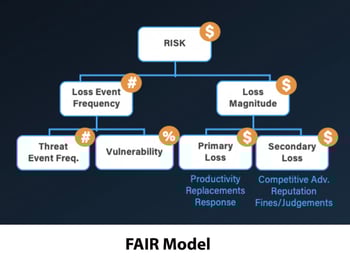
Instead of mental models that vary by analyst, the quantitative approach runs on a standard model that any analyst can use to produce consistent results. At RiskLens, we use the FAIR model — that's Factor Analysis of Information Risk — to perform quantitative assessments using the best available models and techniques.
FAIR takes the guesswork out of the concepts of Loss Event Frequency and Loss Magnitude, the two main components of Risk that are also leveraged in qualitative analysis. The difference is that ranges or distributions are used to capture high and low ends of possible outcomes rather than discrete values.
Various iterations of these inputs are then run through a Monte Carlo engine. The result is not a simple two-axis heat map, but a bell curve showing a range of probable outcomes.
The model breaks down these two factors into subcomponents that can be estimated based on information collected from subject-matter experts in the company and industry-standard data, then builds them back up into accurate, overall estimates of Frequency and Magnitude — with Magnitude expressed in terms of dollars and cents.
By using a probability distribution to identify the impact of potential risks, the FAIR model offers reliable data that can be used to inform business decisions with something more tangible and accurate than color categories (for instance, risks most likely to exceed $1 million, etc., as shown above in a RiskLens output).
A NOTE ON INDUSTRY-STANDARD DATA FOR CYBER RISK ANALYSIS
Good risk analysis requires good data that’s both reliable and relevant to the organization and, specifically for FAIR™ quantitative analysis, covers frequency and financial impact of cyber loss events. Realistically, security and risk teams often don’t have the time or staff to hunt down and interview the subject-matter experts in the organization.
The RiskLens data science team has cracked that problem by applying extensive field knowledge (gained from bringing FAIR risk quantification to a wide client base) with advanced data analytics to mine actionable insights from a huge trove of data collected from industry sources such as the Verizon DBIR and Advisen.
The RiskLens SaaS enterprise platform comes pre-populated with industry-specific data and scenarios that can be augmented with the enterprise’s internal data when available. (Alternative: Take advantage of RiskLens data capabilities as a managed service client.)
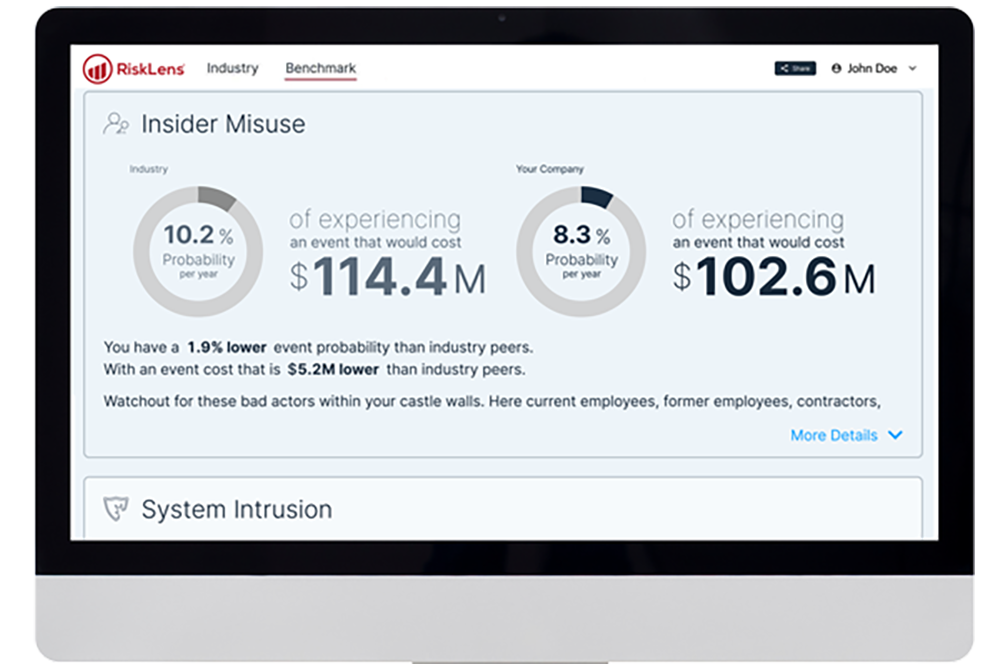 RiskLens-curated industry data also powers the My Cyber Risk Benchmark tool for a quick read on how your organization compares to your industry peers for risk exposure. Try it for free now.
Using quantitative risk analysis, analysts can present decision-makers with a way to visualize risk that's more accurate than plotting points on a heat map, uses financial terms that anyone in the business can understand, and is based on logical analysis that can be explained and defended.
Overall, it offers a more accessible and accurate way to illustrate the impact risk can have on your business, allowing for better team coordination that can be used to better your risk management strategies.
Of course, if you'd still like to present your quantitative analysis on a heat map, there's nothing stopping you
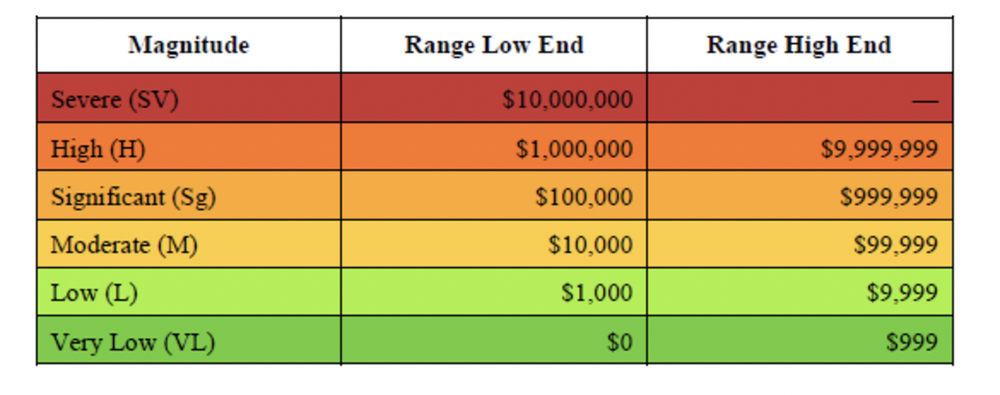
HOW TO MAKE A SMARTER HEAT MAP
-
Run quantitative analysis on your top risk scenarios.
-
Rank them by loss exposure.
-
Group your ranked risks by ranges.
-
Assign colors to those ranges.
Result: A heat map based on solid, quantitative risk analysis.
The Bottom Line
To recap, qualitative analysis and quantitative analysis primarily differ in their foundations — qualitative risk is grounded in the subjective experience of the analyst, and quantitative risk is grounded in the probable financial loss from cyber events. Both have their place, but if you're trying to determine your organization's cyber risk management strategy, we recommend you perform a quantitative risk assessment to put a dollar value on the probable risk you face.
Although it might be beneficial to quickly group individual risks from a qualitative perspective, it's better to use the standard model for cyber risk quantification, FAIR, to place a dollar value on the full range of cyber dangers your business faces so you can move forward with confidence.
Want to see the difference for yourself? RiskLens can introduce your business to quantitative risk assessment with the FAIR model. Contact us for a demo