
 We recently helped a client in financial services use cyber risk quantitative analysis to plan defenses against double extortion ransomware AKA big-game hunting ransomware. These are sophisticated, high-stakes, multi-level cyber attacks, with many moving pieces, the sort of analytics challenge that plays to the strengths of the RiskLens cyber risk quantification (CRQ) platform.
These attacks often start with gaining a network foothold initiated through phishing, move on to encrypt assets with sensitive information, then use data exfiltration and threatened release of the information to accelerate the extortion, adding data breach to the original business interruption.
 Josh Griffis is a Senior Risk Consultant for RiskLens with extensive previous experience in cybersecurity and risk management in the financial services and retail industries, including specializations in digital forensics, e-discovery, incident response, SOC management, security architecture, security engineering, threat Modeling, and CRQ.
Ransomware Analysis on the RiskLens SaaS Platform
Our client leveraged some highly developed RiskLens CRQ functionality to understand the size and details of their loss exposure to this type of ransomware.
The platform is built to implement quantitative cyber risk analysis with Factor Analysis of Information Risk (FAIR™), the recognized standard for cyber risk quantification and the model implemented by the RiskLens cyber risk analytics platform. By breaking down risk into factors, FAIR enables data to be applied to the frequency and magnitude of loss events, ultimately quantifying risk or loss exposure.
The workshop format of the RiskLens SaaS application, carefully and thoroughly steps us through an interview process to gather the most relevant data to fill out the FAIR factors.
A scenario approach guides us to focus in on loss event scenarios with a well-defined scope (a threat actor, a means of attack, an asset at risk and an impact resulting in a loss).
This type of ransomware delivers a one-two punch, loss of availability (through encryption) and loss of confidentiality (through data breach) so our goal was to develop two scenarios:
- Risk Scenario #1: External malicious actors attempting network foothold, targeting a critical application resulting in a loss of availability loss event.
- Risk Scenario #2: External malicious actors attempting ransomware, targeting a critical application resulting in a loss of confidentiality loss event.
Data – The platform comes stocked with data on probability and costs of cyber events from 1) the organization’s internal data or 2) data curated by the RiskLens data science team. The platform presents the relevant data in handy “data helpers” at each step of the analysis.
 New from RiskLens data science: 2023 Cybersecurity Risk Report, featuring deep dive insights from CRQ experts on top cyber risk scenario loss exposure by industry, by threat category, and more.
For this analysis, we could leverage either of two data helpers, depending on where we thought we would have the strongest data: Network Foothold (for instance, we are confident in our frequency data on phishing/spam rates) or Ransomware (for instance, we have a handle on how often that type of malware lands on our endpoints). Keep in mind: When the organization lacks historic data, the platform steps in with curated data based on industry sources.
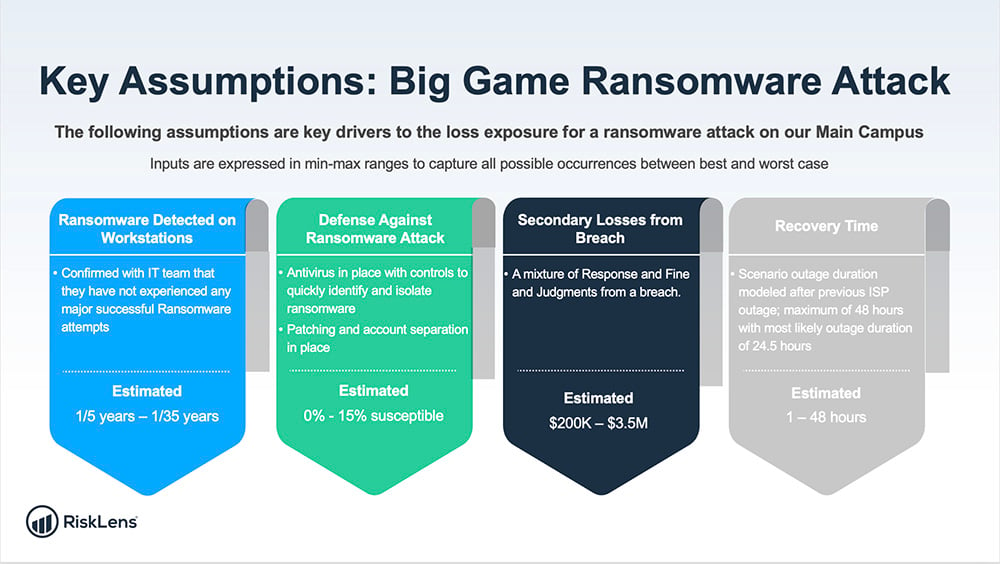
We started with determining our frequency data, as well as stepping through the condition of our controls in place to quantify our susceptibility to attack. Then we moved on to data selection for the magnitude factors. For instance, we focused on loss of availability quantified in labor or productivity costs related to recovery time, as well as probable costs of lawsuits or regulatory penalties. We estimated how many unique, sensitive records would be involved in a breach (the records count is ultimately the biggest determinant in probable cost of the loss event).
(We chose to push the most likely value for a ransomware payment to zero in the range that was modeled. Ransomware is rarely paid and even if paid, does not guarantee the attackers will unlock your system or keep your data private.)
Here’s a look at how we quantified some of the FAIR factors for analysis:
(Note: These charts don’t show the actual customer’s data, but representative numbers based on modeling for a mid-sized organization in the financial services industry).
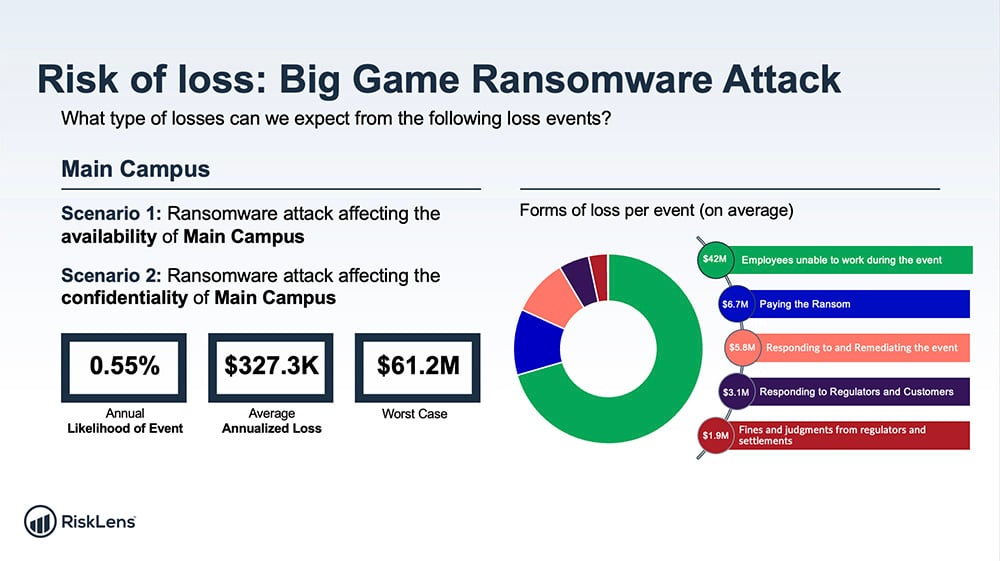
With our data squared away, we could run the RiskLens platform’s Monte Carlo risk simulation analysis engine, generating 50,000 simulations of our risk scenarios to show the range of probable outcomes (10th percentile, most likely, 90th percentile) in dollar losses.
We used the platform’s powerful capability to generate an aggregate risk assessment that pulls multiple risk analyses into one overall view . This chart shows the result:
The Goal: Cybersecurity Decision Support for the Client
When the team presented the analysis, the CISO was pleasantly surprised that the controls in place would be so successful at stopping a network foothold, keeping the probable frequency relatively low. But the probable magnitude would still be a painful experience.
RiskLens reporting always shows probable loss not just on a per-event basis but also annualized so a CISO can be smart about how much to invest in security for reasonable ROI. We were able to help the CISO make an informed risk decision -- and that’s the point of why the RiskLens platform exists.
.jpg?width=1024&height=281&name=RL-Banner-1024x281v1%20(1).jpg)