
 RiskLens clients ask questions related to all aspects of their FAIR and risk quantification journey. These questions may come while initially learning about FAIR and the RiskLens platform, during onboarding - when the client learns the ins and outs of the platform - or when learning to conduct a quantitative analysis and comparison efficiently and effectively during a RiskLens Professional Services engagement.
We have compiled a list below of frequently asked questions from prospects, customers, and partners, and answers for easy reference. For any additional questions, please reach out to support@risklens.com.
Erin Macuga is a RiskLens Risk Consultant.
Read more by Erin: How to Conduct a Detailed Analysis of a Top Cyber Risk with RiskLens
Q: I like the insights provided from an analysis, but it seems to take a long time to gather information, talk to SMEs, and understand the results before talking with leadership. I need a quick turnaround on analyses; is there a faster way?
A: Yes. We have significantly reduced the amount of time it takes to complete an analysis. This was accomplished by the creation and usage of frequency and magnitude data helpers, making analysis work focus on data selection over data collection and completing an analysis in hours instead of days. Additionally, all new customers will receive a starter content pack with a handful of pre-populated scenarios and a data helper set.

Q: Does RiskLens have industry data that can be used?
A: Yes. During the onboarding process, customers receive pre-populated data helpers and loss tables with industry data. RiskLens directs them towards what data points could be refined further for organizational context. The loss tables and data helpers can be updated to better represent the organization’s data and should be reevaluated on a fixed schedule (e.g., quarterly, yearly).
This industry data provides a starting point that allows a client to see immediate return on their analyses. Furthermore, new customers purchasing RiskLens will receive starter scenarios that are pre-populated in their instance to enhance that immediate return.
See the RiskLens platform in action. Schedule a demo now.
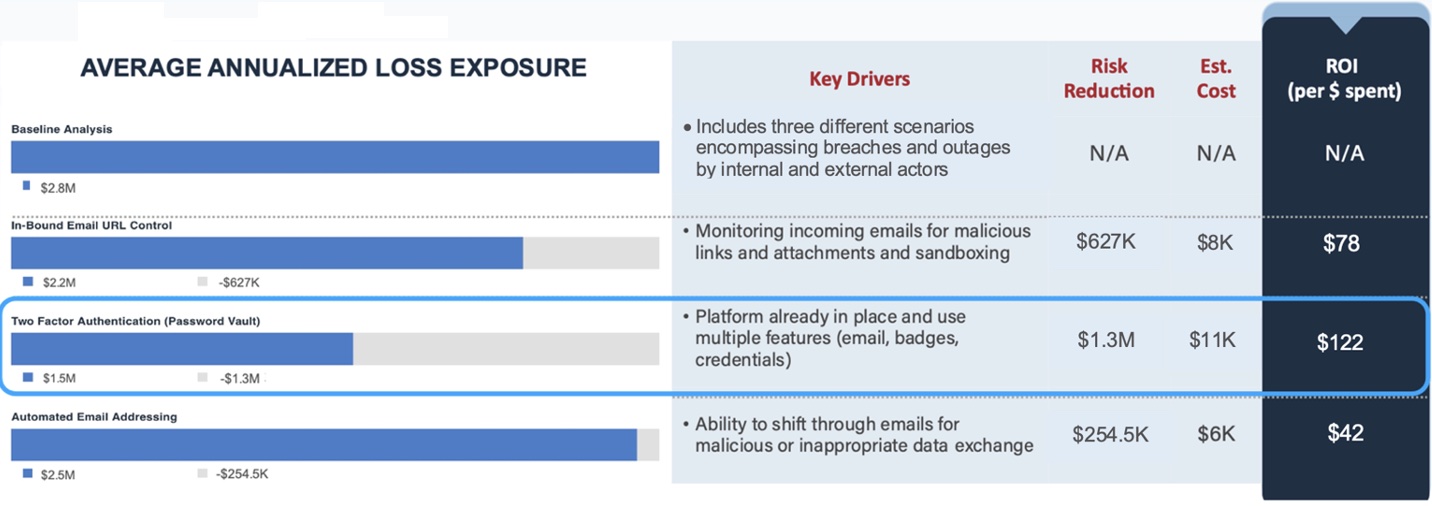
Q: My organization is evaluating multiple control options. Can I compare multiple controls to determine which one would be better?
A: Yes. The RiskLens platform has a Cost-Benefit Analysis module that enables the analyst to create and view a cost-benefit scenario. The analyst will need to adjust the appropriate workshop question for each scenario if the specified control were to be implemented. The analyst also has the ability to enter the cost of the control that is being considered to show the return on investment (ROI).
Q: What’s the difference between Native, Guided and Triage modes?
A: Native mode enables an analyst to work directly at FAIR. This means that the analyst will see the six forms of loss on the magnitude side of the model and have the option to work at Loss Event Frequency, Threat Event Frequency, or Contact Frequency, and Probability of Action on the frequency side of the model.
Guided mode provides predetermined questions based on how the analysis was scoped. For example, if a confidentiality scenario is being quantified, the questions on the magnitude side of the model (both primary and secondary loss) will be based on the scoped scenario, removing any questions not directly related to that scope.
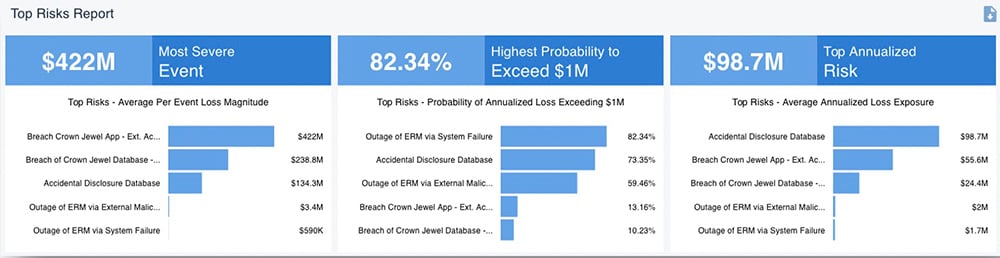
Triage mode is only found on the frequency side of the model and is meant to be a quick analysis of how often the scoped scenario may occur, involving answering simple questions with predetermined ranges to define an appropriate frequency. With frequency in hand, an analyst can leverage Data Helpers and Loss Tables to answer questions on magnitude of impact. Then the analyst can, in minutes, run a Rapid Risk Assessment to rank an organization's top risks by loss exposure.
See the RiskLens platform in action. Schedule a demo now.
Q: When can Loss Tables and Data Helpers be used?
A: Data Helpers can be used at any time throughout the platform. This feature should be used for the most common questions that an organization will answer during any analysis, such as employee wage and labor hours. Additionally, they provide a way to complete an analysis in a timely fashion. Data Helpers and loss tables can be used in conjunction when working in Guided mode.
Loss Tables will come into play on the magnitude side when working in Guided mode. Specifically, when quantifying a confidentiality scenario, the platform will pull from the loss tables within secondary loss. When quantifying an availability scenario, the platform will pull from the loss tables within primary loss and secondary loss. The loss tables will only be pulled if the appropriate workshop modes are selected. Furthermore, the loss tables are broken down based on record count and the range of cost that could be incurred by an organization if the event being quantified did occur.
Q: When would I create a Risk Assessment versus just a scenario?
A: A scenario is how an analyst will work within the RiskLens platform, whether evaluating a single scenario for a tactical understanding or looking to complete a more strategic assessment. Each event that an analyst wants to quantify represents a single scenario and contains one asset, one threat, one effect and optionally one method.
If an analyst wishes to create a risk assessment, that can be completed to see an aggregate view of similar scenarios. For example, if the analyst is looking to quantify the entire risk of the organization’s cloud resources, the analyst would create a risk assessment to see the overall aggregate risk. Furthermore, a risk assessment must be completed and locked to conduct a comparison assessment.
See the RiskLens platform in action. Schedule a demo now.