
When companies are new to FAIR™, a common question when getting started is “how difficult and time-consuming will quantifying cyber risk be?”. The purpose of this blog is to emphasize that not every analysis requires the same amount of rigor that goes into what is typically thought of when performing a detailed quantitative analysis. In fact, in some cases, it is not even encouraged. Many risk and scenario analyses should be done quickly, to determine which are top risks and which are not.
When teaching new practitioners how to operationalize FAIR, I like to bring up this visual contrasting two capabilities of the RiskLens platform: Rapid Risk Assessment for triage and the detailed Top Risk Assessment.
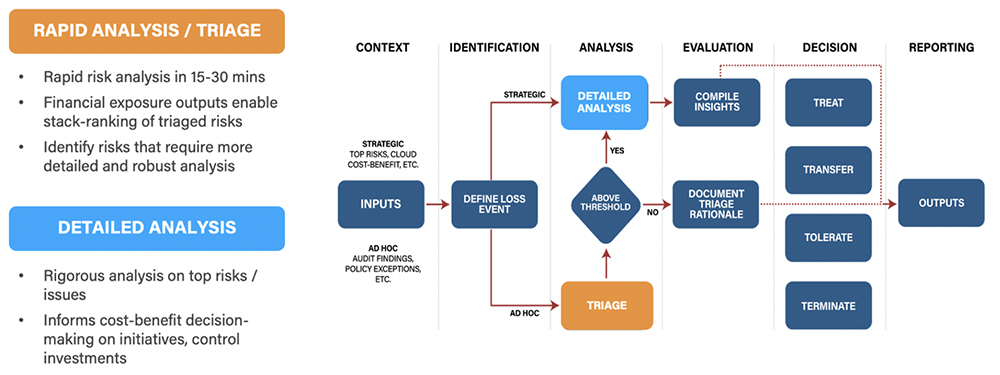
If this process is leveraged correctly, you will see that not all types of risk require in-depth analysis. For instance, detailed analysis is only intended for rigorous analysis on top risks being reported to the Board, Audit Committee, etc. or to inform decision making on significant investment decisions related to strategic initiatives and/or control improvements. Through a guided workflow and built-in data features, detailed analysis is highly automated on the platform.
Day-to-day decision making on risks typically runs on the rapid analysis process. Even top risks, as I will describe further in the section below, typically go through the process of triaging to help identify and prioritize which top risks that detailed analysis should be performed on.
Rachel Slabotsky is Sr. Manager, Professional Services, for RiskLens
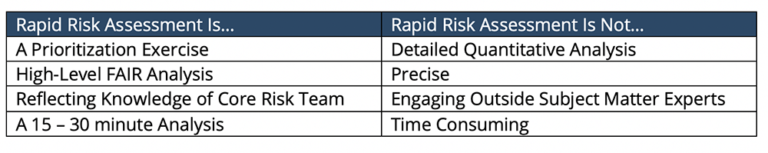
So, what is Rapid Risk Assessment? The table below can help to illustrate this point:
Now that we’ve level-set on terminology, let’s walk through a couple of practical examples where we see Rapid Risk Assessment come into play.
Webinar: See RiskLens Rapid Risk Assessment in Action
Prioritization of Top IT Risks (Strategic)
One of the most common uses of the Rapid Risk Assessment capability in the RiskLens platform is to rapidly quantify and effectively prioritize perceived top risks. For many organizations embarking on their journey to risk quantification, this serves as a starting point to gain clarity into their overall risk landscape.
From there, depending on the objectives of the organization, a subset of risks can be selected for detailed analysis to gain greater insight into select top risks for executive level reporting or to serve as the baseline for cost-benefit decisions for investments.
In order to rapidly analyze risk to meet this objective, the organization must first start with a list of perceived top risk scenarios. FAIR encourages use of a common language to form a consistent definition of risk, also referred to as a loss event, which consists of a unique combination of asset, threat, and effect. For example, a loss event may be defined as an external malicious actor <threat> breaching PII in a crown jewel database <asset> resulting in a loss of confidentiality <effect>.
Learn more: How to Clearly Define a Risk Scenario Statement for FAIR Analysis
These loss events can be pulled and translated from an existing risk register, or through a half-day identification workshop, which RiskLens can facilitate. The scope of the identification of the top risks may vary, but typically is performed within a given segment of an organization (e.g., Business Unit (BU) or Line of Business (LOB). Either way, you can expect to rapidly assess a list of 20-40 probable loss events, or in some cases more. Once the list is established, the process of rapid risk assessment begins.
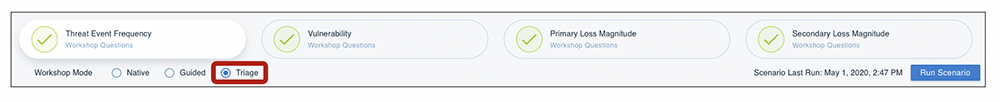
When performing a Rapid Risk Assessment, you are making direct estimates of how many times over the next year the loss event will likely happen (“frequency” in the FAIR model) and when it does how much in financial terms it will cost the organization (“magnitude” in the FAIR model). In the RiskLens platform, the frequency side is answered via the Triage workshop mode.
Threat Event Frequency: Select Triage
For the magnitude side of the model, two time-saving capabilities, Data Helpers and Loss Tables, are leveraged to answer the questions. With Data Helpers, analysts can store data for repeated use in answering risk analysis workshop questions. Loss Tables combine industry and internal loss data (for instance, about losses associated with a data breach) for quick access in analysis.
Primary Loss Magnitude and Secondary Loss Magnitude: Select Guided

Helpful Hint: If you happen to be performing a rapid risk assessment and get caught up in the details of a workshop input, it’s helpful to revisit the objective of this exercise: to stack rank or prioritize the organization’s top risk scenarios. Context is key. These results are not intended to go directly to the Board or Audit Committee nor to be leveraged to make large investment decisions. Therefore, leverage the knowledge in the room to make the best informed estimate – using wider ranges, decreased confidence levels and benchmarking against the inputs of other scenarios, when needed.
View Analysis Results in the Dashboard
The Top Risks Report dashboard in the RiskLens platform (pictured below) provides a dynamic dashboard for displaying various outcomes along the distribution of loss exposure, generated by thousands of Monte Carlo simulations run by the platform. Depending on the preference of the organization, the 10th %, Most Likely, 90th %, Minimum, Average, or Maximum Annualized Loss Exposure values can be pulled and incorporated in the format report. In general, the Average serves a simple selection that captures the entire set of simulations.
Top Risks Report
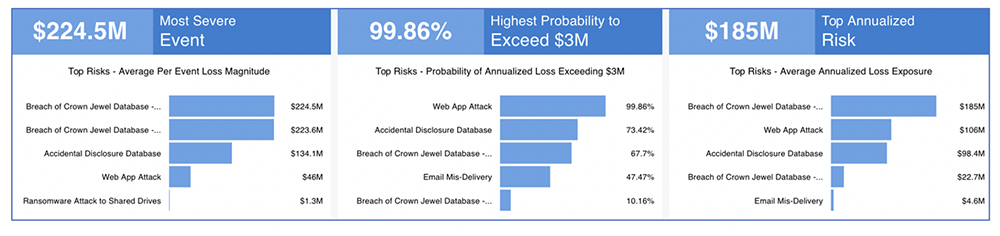
The report also displays three unique views from left to right as follows:
- Most Severe Event: identifies the largest single event magnitude of a loss event assuming it materializes (does not factor in event frequency).
- Highest Probability to Exceed: displays the risk scenarios with the greatest likelihood to exceed a specified threshold (in this case $3M) over the next year. The threshold can be configured to meet the organization’s defined threshold (if available).
- Top Analyzed Risk: reports the combined of loss event frequency and loss magnitude of each loss event on an annualized basis. This view is the most effective way to make an apples-to-apples comparison of risk.
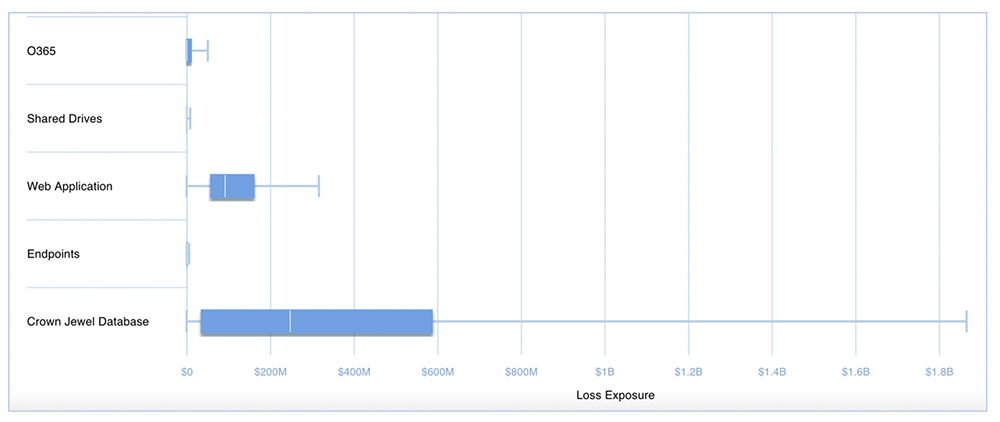
RiskLens also provides additional reporting that displays the amount of aggregate risk from each of combined top risk scenarios. This is useful to determine the highest concentrations of risk, for example, by asset, threat, or loss effect (based on the C-I-A triad). Below are a couple of examples of the aggregate reporting:
Aggregate Loss Exposure by Asset
Aggregate Loss Exposure by Threat
By viewing the ranking of risks, a decision maker is able to evaluate which risks could be meaningful candidates for detailed analysis, which in turn can help to inform the following:- Top risk reporting the Board, Audit Committee, or Executive Leadership
- Serve as a baseline for cost-benefit decision making on investments
- Provide an economic component to cybersecurity frameworks (e.g., NIST CSF)
- Results of Risk Assessments to satisfy regulatory/compliance requirements (e.g., HIPAA , NYDFS)
Tactical (Ad Hoc) Analysis
When it comes to tactical analysis, this may include day-to-day risk-based decisions, including policy exceptions, issues, or even audit findings. The key here is to start with identifying the most probable FAIR-based risk scenario(s) that directly relate to the concern at hand.
For example, let’s take a policy exception related to mainframe password settings not complying with corporate policy. Let’s assume that the primary concern related to this issue/exception is a disruption to the availability of a supporting business-critical process. Further, we could assume that an external actor would most likely take advantage of the weak password settings.
We would then analyze the following scenario: the amount of risk associated with an external malicious actor disrupting the availability of the mainframe environment (due to weak password settings). We could also define additional scenarios related to other threat actors or concerns (e.g., confidentiality or integrity), if applicable.
From there, the same process to perform rapid risk assessment in the RiskLens platform (described above) can be followed.
To recap, the RiskLens platform can be leveraged to rapidly quantify risk to help prioritize perceived top risks and determine where to focus efforts based on larger volumes of tactical findings and issues.
To learn more about how RiskLens Rapid Risk Assessment can help build efficiencies into your quantitative risk management program, schedule a demo.