
The RiskLens Platform is first of all a decision support tool – and it provides a range of sophisticated reports that can be finely tuned to the decision at hand. A case in point is the platform's capability to distinguish the risk in high frequency/low impact events (let's say steady losses from small scale attacks on an application) vs. low frequency/high impact events (that massive data breach).
One of the cuts you can take at the data is seeing financial loss expressed as an "average" or "most likely" value. Clients often ask, Which is better?
I agree with Einstein that “Everything should be made as simple as possible, but not simpler.” That’s why I don’t give an overly simplistic and prescriptive answer of “choose this one.” However, I can give an overly simplistic explanation of what the average and most likely values represent in baby steps. That way, clients can decide how to best communicate and inform decision makers on the results of an analysis.
Baby Step 1: Average vs. Most Likely Example Imagine a room filled with 10 people. Then, suppose you were looking to gain an understanding of the demographics of the room, so you look to gather metrics on the ages of people in the room.
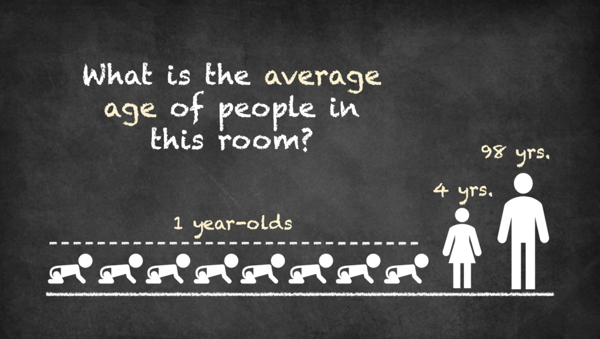
Here is what you learn about the 10 people:
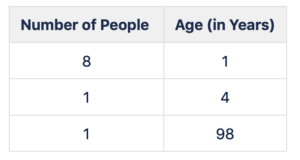
The average (Avg) age would be 11 years old; the most likely (ML) age would be 1.
Now, was anyone in the room actually 11 years old? No. However, 11 is the arithmetic mean that reflects the entire spread of the ages of people in the room. And, since there was one seasoned person in the room (98 years), the average age was higher than the majority of people in the room. In contrast, the most likely age of 1 only reflects a subset of the ages of people in the room. Put differently, the average is a number that considers the whole data set (including outliers/tails), whereas the most likely only considers a segment of the data.
For a more thorough description on the calculations behind RiskLens reporting, check out the blog post on “ What Does RiskLens Reporting Tell Me?”
Baby Step 2: Average vs Most Likely Examples in FAIR
Now that we’ve conceptualized the difference between average and most likely in a silly example, let’s contextualize those values in the context of two FAIR examples.
Keep in mind, in the room example, the average and most likely values applied to a data set of 10. In quantitative analyses with FAIR, Monte Carlo simulations are run thousands of times (learn more: 5-Minute Introduction to Monte Carlo Simulation) and those thousands of simulations compose the data set that the average and most likely values are derived from.
Event A: a high frequency, low impact event 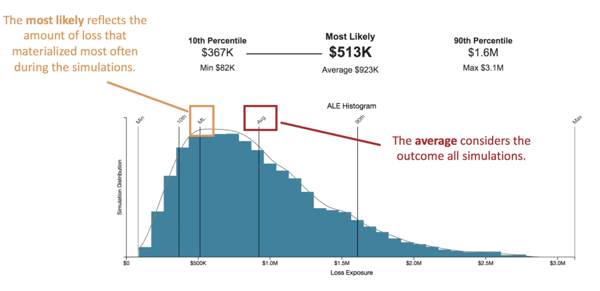 Here we have a ML of $513K and Avg of $923K. The ML only represents the subset of the distribution. It shows part of the picture. It shows the amount of loss that will materialize most often in a given year. It is not considering the Min of $82k or Max of $3.1M. In contrast, the Avg is a considering both the Min and Max, then everything in-between. It reflects the whole picture.
Event B: a low frequency, high impact event 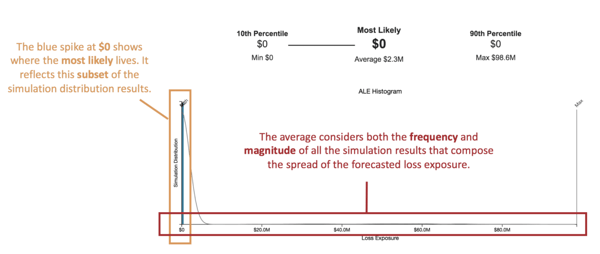
Here we have a ML of $0 and Avg of $2.3M. That’s a big difference! Why is that? Well, this event has a really low frequency (more specifically, it’s Min: 0.01 = 1 in a 100 years Max: .09 = 1 in 11 years). So, when the simulations ran, loss didn’t always materialize in a simulated year. In this case, most simulated years didn’t show loss materializing which is why the ML is $0. However, since thousands of simulations were run, there were times when loss did materialize, and the impact could be huge (Max: $98.6M). The average considered both the Min of $0 and Max of $98.6M. It also considered the relative frequency of those amounts of loss. In short, the Avg gives a perspective on the whole data set, not just a subset of it.
Deciding Whether to Communicate ML or Avg
So, the simple answer to the question, “Should I report on the ML or Avg?” is: It depends. The context of the analysis will direct whether the ML or Avg or both should be communicated. If the Avg is misleading because of the influence of outliers, then ML might be your best bet. In a more normal distribution, go with whichever measure would make most sense to you and your audience. Ultimately, so long as you accurately and in a digestible manner tell what the data point is describing, then it really is dealer's choice.