 You would be hard pressed to find CISOs who say they like having to defend their budget prioritizations with technical jargon or heat maps. Unfortunately, not every company has the resources or desire to implement an entire quantitative risk management program just to make those periodic meetings a little less painful.
If you are not interested or ready for a full quantitative risk program but want to experience the benefits of risk-based decision-making, here are three steps to begin with RiskLens industry-specific cyber risk reports.
Step 1: Socialize Generalized Quantitative Industry Reports
Socializing quantitative risk reports within your organization is a great first step on the risk quantification journey.
Whether you are planning to fully operationalize quantitative risk into your decision-making culture, or to just be more prepared for your next annual budgeting cycle, having your audiences familiar with and interested in quantitative risk reports in general is a great first step.
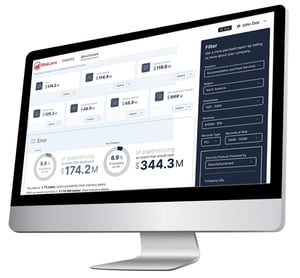
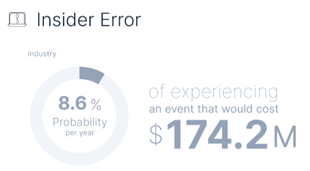
The free RiskLens Industry Cyber Risk Report puts an industry lens on top-of-mind cyber events making headlines every day. The report – based on your industry, region, and company size -- enables you to communicate how probable these events are, as well as how much they cost, on average, when they occur.
Armed with this knowledge, you can begin to take a risk-based approach to control investments prioritization.

Step 2: Customize Industry Reports to See How You Stack Up
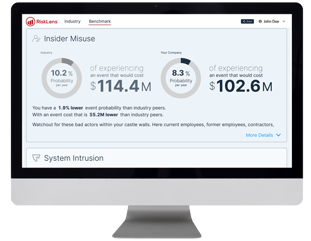
While averages are a great first step– they are just that, averages. If you want to take a closer look at your risk landscape and how you compare to the industry average, My Cyber Risk Benchmark is available for a small fee.
This upgraded report allows you to further customize the report based on data type and record count and factors in your security posture by leveraging your SecurityScorecard Rating. Not a SecurityScorecard member? No problem. Your grade is automatically generated based on your company URL. To learn more about SecurityScorecard, click here.
The additional inputs allow you to understand how these events would look at your company specifically, while still comparing to the industry average. This detailed look will provide even greater insights; for example, you may be much less likely to experience a ransomware attack than the industry average, but at a higher risk for denial-of-service attack based on your security posture.

Step 3: Evaluate Changes to Security Posture
Event probabilities are based on historic cyber events in the industry, combined with performance metrics in several key areas, such as network security, DNS health, patching cadence, endpoint security, and application security.
What this means is that security posture and overall control strength play a big a role in whether your company will be making headlines in the next cybersecurity news cycle.
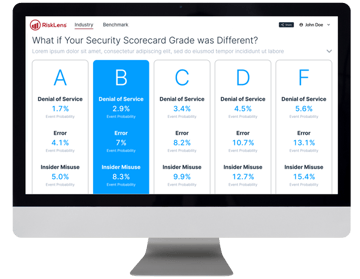
Understanding where you are today is powerful but understanding where you could be tomorrow or next year is key to effective planning and resource management. The easy-to-use report interface allows you to quantify the impact of changes to your security posture, based on your SecurityScorecard Rating.
The SecurityScoreCard Rating is based on performance in ten areas including Network Security, DNS Health, patching cadence, etc. Performance changes in one or more of these key areas can have an impact on your SecurityScorecard Rating and your risk to the top cyber events.
For more tips on how experts use this, join the upcoming webinar, CRQ for All: How to Use My Cyber Risk Benchmark.
Whether you are planning a big initiative that is going to have you moving from a C rating to an A, not sure if it is worth the investment to change from a B to an A, or worried that with the aging infrastructure, you may fall from a B to a C next year, the My Cyber Risk Report will enable you to understand how these potential events play into your event probability and risk.

Whether you use them as a jumping off place for a full quantitative program or rely on them for the occasional insight, customizable industry risk reports from RiskLens are a great place to begin your quantitative risk journey. Click here to begin your journey today.