 The Problem: A large financial institution was concerned when they identified that sensitive personal information (PII) was housed on unsupported servers running end-of-life (EOL) software. They’d run a DREAD analysis but that gave them a threat assessment not a risk assessment. To provide a perspective that would enable them to conduct a cost-benefit analysis of their security investment they needed to quantify that risk in useful financial terms.
The risk team turned to the RiskLens Cyber Risk Quantification platform to apply the FAIR model for quantitative risk analysis to
- Understand their current state of risk and
- Analyze the potential risk reduction associated with a technology refresh for the unsupported servers - their presumed fix for the problem.
Setting Up the FAIR Analysis, Based on Company Data
With the help of RiskLens consultants, the team constructed risk statements for analysis using the three building blocks from FAIR that define risk: a threat acting on an asset and having an effect.
- Threat: Cyber criminals
- Asset: Database (containing PII) running on unsupported servers
- Effect: Confidentiality loss
Analysts next applied the FAIR model to decompose the elements of risk (or a “loss event” in FAIR terms) into two buckets: Loss Event Frequency and Loss Magnitude in dollars. On the Loss Event Frequency side, analysts collected data from within the organization on the number of attempts by threat actors to hack into these databases and exfiltrate data…and the vulnerability or percentage of successful attempts.
On the Loss Magnitude side, analysts collected internal data on
- Primary Loss: Based on a combined hourly rate for employees who respond to a data breach (IT, management and legal staffs provided the wage data).
- Secondary Loss: Mostly the cost of credit monitoring offered to customers but also including potential legal, PR, litigation and other costs, based on industry data supplied by RiskLens.
Surprise! Analysts Find a Much Bigger Problem - and Another Solution
A huge "ah-ha" moment occurred during the Magnitude data collection process. When interviewing the asset owner, it was discovered that the database not only contained employee PII data, but it also stored the DLP (Data Loss Prevention) dump data (e.g. emails sent to the wrong recipient containing sensitive data) which included customer PII data.
This crucial insight had not been brought to light in the prior assessment because the question of "how many unique records?" hadn't been asked. In short, it was a much larger data repository than they previously recognized. This exponentially increased the number of records and subsequently the monetary impact of the event as well. This insight demonstrated how FAIR fosters a rigorous analysis process. It also enabled the risk team to identify another remediation option: DLP data retention reduction.
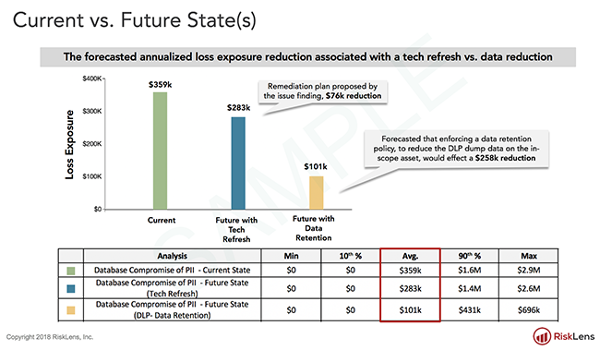
In other words, by periodically purging old DLP dump data, they could reduce the amount of records potentially exposed to a breach.
Analysis Results Point to a Clear ROI Winner in Risk Reduction
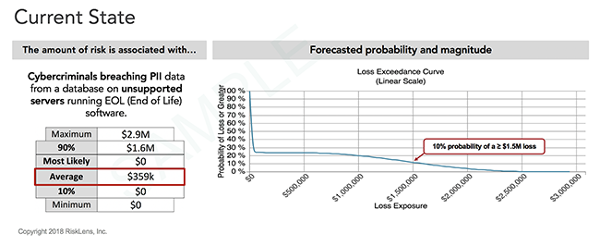
The next step was to enter the collected data in the RiskLens cyber risk quantification (CRQ) platform to produce a view of the Current State of risk. Powered by a Monte Carlo analysis engine, the CRQ platform runs thousands of simulations to produce a range of probable outcomes in dollar amounts displayed as a Loss Exceedance Curve.
The horizontal x-axis shows a range of loss exposure (annualized). The vertical y-axis shows probability of a loss being greater than the corresponding point on the curve for the x-axis. 
With current state analysis in hand, the team could then run “what-if” analyses in the RiskLens platform to test which of the two proposed controls would produce the most reduction in loss exposure (based on the organization’s previous experience with controls) for the least investment, again shown as a range of probable outcomes. The result was a clear choice: Changing its data retention policy and reducing the numbers of stored records would reduce risk far beyond a technology update. 