
 Many organizations still rely on qualitative risk reports to aid in determining how to prioritize cybersecurity control implementations and cyber related improvements within the organization. A qualitative summary of cyber risks is easy for decision makers to grasp, particularly if it’s what they are used to seeing. But typically, qualitative risk assessment isn’t supported with any analytic rigor, nor do vague ordinal colors or numeric 1 through 5 scales enable the economically based trade-offs that are necessary for organizations to manage limited resources.
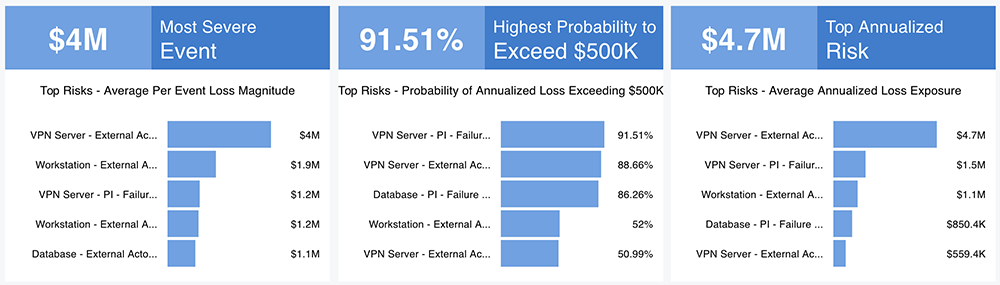
Using the RiskLens platform, the only cyber risk quantification platform purpose-built on the Factor Analysis of Information Risk (FAIR)™ model, organizations can quantify their cyber risk in economic terms, driving rigor, defensibility, and objectivity into their decision making. The RiskLens platform provides numerous reports, including the Top Risk Dashboard.
This reporting option allows an organization to compare their most critical cyber risk scenarios based on the events with the highest expected loss exposure, the highest likelihood to exceed a specific threshold, as well as the top annualized risk. On the RiskLens platform, a large number of scenarios can be easily compared, in a simple and intuitive way.
Combining Qualitative and Quantitative Risk Assessment Techniques
While informative, for some organizations, the jump from qualitative to quantitative reporting may be too big a leap to make at once. For those organizations not yet comfortable with communicating their cyber risk exclusively in financial terms, the reporting capabilities of the RiskLens platform can be used to inform qualitative reports that are easily digestible.
Qualitative reports can be an effective reporting option to communicate a summary of an organization’s cyber risk, but they can also lead to confusion and invalid assumptions which may result in inaccurate reporting.
 In order to avoid inaccurate reporting, the following criteria must be met:
1. Qualitative risk assessment reporting is backed by clearly defined quantitative ranges, approved by stakeholders
2. Underlying quantitative scales are consistently and transparently used and communicatedTo be effective, qualitative reports need to be based on clearly defined quantitative ranges. These ranges must be transparent and approved by the key business stakeholders. Encouraging stakeholder involvement is crucial to ensure that analysts are fulfilling their responsibility to enlighten decision makers so they can make well informed decisions. As a result, it is the business’s responsibility to properly define a “small”, “medium”, or “large” event from a financial perspective through collaboration with stakeholders and it’s the analyst’s responsibility to effectively report out based on those tiers.
Applying FAIR Concepts to Qualitative Cyber Risk Reporting with the RiskLens Platform
From a FAIR perspective, risk is made up of the frequency and magnitude of loss events. With that in mind, qualitative supplementary reporting should be able to communicate how often an event is likely to occur as well as how much financial loss an organization is likely to experience as a result of that event occurring. In FAIR analysis, the combination of these two values is referred to as Annualized Loss Exposure (ALE), and is represented as a distribution.
When working with distributions like ALE there are multiple values to choose from (e.g., the average, the 90th percentile, etc.), meaning a determination has to be made of what value should be called out by the analyst for reporting.
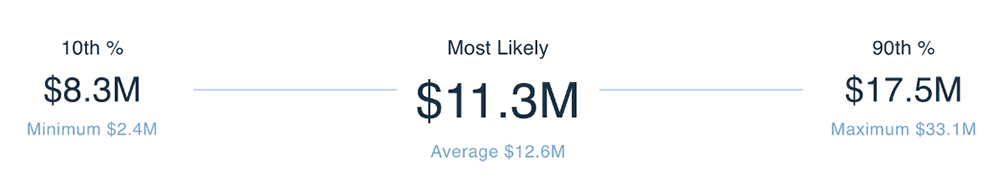
The RiskLens platform allows for a range of inputs represented as a minimum, most likely, and maximum value to shape the ALE distribution. By entering these inputs as ranges, the estimates in a FAIR analysis are always future looking; this enables the analyst to account for any uncertainty while maintaining accuracy with a useful level of precision in analyses.
The platform then runs Monte Carlo simulations to get a distribution of loss (ALE range, shown below) that an organization can expect to see if a particular event were to occur. The simulations are taking samplings from within all the ranges of inputs and running multiple scenarios of those values to get this distribution. Additionally, the dynamic reporting options within the platform enable the analyst to create reporting based on the stakeholder’s preferred reporting metric.
Ultimately, the point on the distribution that is selected (e.g., the 90th percentile) should be based on the organization’s risk appetite level and that metric needs to be consistently used throughout all reporting; it cannot vary from analysis to analysis.
RiskLens helps organizations quantify their cyber risk appetite too, as described in this blog post, How to Set a (Meaningful) Cyber Risk Appetite with RiskLens.
Consistent, Transparent Communication Enables Good Qualitative Risk Assessment
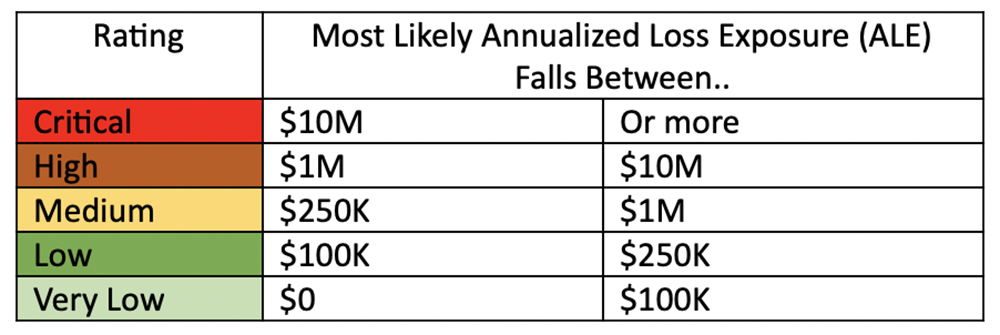
When it comes to definitions for cyber and operational risk reporting, it is imperative to ensure consistent alignment on terminology. In other words, when deciding how a “medium” loss event is defined, it should represent a range or monetary value that is acceptable to all stakeholders. One stakeholder can’t define “medium” as $500K to $1M and another stakeholder as $1M to $5M. By having a standard value associated with “medium”, stakeholders can properly interpret the results from an analysis and see results in alignment across reporting (see example below).
A significant transformation in process should always be met with a change management plan to ease the transition. Cyber risk reporting is no different. If switching “cold turkey” from qualitative to quantitative reporting will not work for your organization’s culture, then supplementing with well-defined qualitative reports can aid in the adjustment. Qualitative reports can be simple visuals that are easily digestible to the least technical stakeholders to summarize significant risks to the organization. Additionally, when they are created properly and have clearly defined metrics, labels, and data points, they can be useful in providing insight into allocating resources and what an organization needs to prioritize for remediation purposes.
Erin Macuga is a Risk Consultant for RiskLens