
In my previous post on this subject, after defining precision, we covered the dangers of reporting only a single data point using Value-at-Risk (VaR) models for cybersecurity risk. The key takeaway is this:
"when analysts use a single data point... they are forced to report a predictive outcome that shoehorns decision makers into thinking only of the worst case."
 We regularly run into analysts making claims such as, "our risk is $45,890,034 with 99% confidence." The first problem with this statement is it's a single data point, as we previously outlined. The second problem – what we will cover this week – is how precise the number is. How do VaR models get to a conclusion of $45,890,034? They most commonly utilize Monte Carlo simulations that analyze multiple input variables, some of which are expressed as dollar figures.
This is not a problem; and, in fact, Factor Analysis of Information Risk (FAIR) utilizes Monte Carlo simulations in a similar way to other VaR models. We run into a problem when our results imply a level of precision that cannot possibly ring true. Let me explain by walking you through a common way of gathering data.
What goes into the model drives what comes out
Risk analysts work with Subject Matter Experts (SMEs) from all over the organization to identify how an organization will experience loss. These losses might manifest as a result of a data breach or an availability outage. The burden on the risk analyst is to find the right SMEs to help describe how the loss will play out. What happens in these meetings is that SMEs share estimates of outcomes in dollar figures. They use statements such as, "it would cost approximately $3.5 million to contain all of the damage to our brand". Taking that and many similar statements as inputs, the VaR model will run calculations and provide an output such as our $45,890,034 number above. But, why can't we run these numbers up to management with a high degree of confidence? It's math; it just works!
Mathematical calculations, including the Probability theory techniques we use, are straight forward. However, risk analysis is not as straight forward, simply because we're forecasting future loss. That's where analyst results such as $45,890,034 fall apart. How confident can you really be in such a precise number? Will your management appreciate predicting $45,890,034 in loss? There is a better approach to using these numbers, and it's simple.
Reporting better results
Take a look at the figure below. 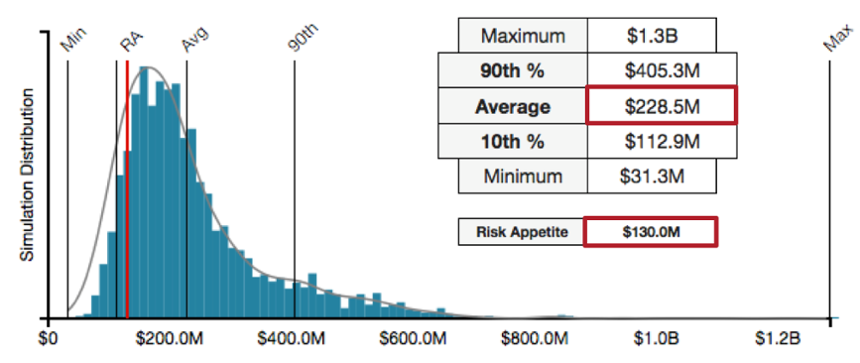
What did you hone in on? Hopefully, you noticed the average and the risk appetite outlined in red. The biggest difference in these numbers and our $45,890,034 number is, we do not communicate too high a degree of precision. No matter what data point we're putting in front of management, we have to remember and embrace the level of uncertainty we had in our inputs. If we used $3.5 million as the input for dealing with brand damage, then our outputs should reflect that level of precision. In forecasting future loss, its much more appropriate to communicate approximations because we can better express the amount of uncertainty we have in our inputs.
We would therefore change our $45,890,034 number to an approximation such as $45.9 million whenever it shows up. And, following on the guidance from the previous post, we would use a range to describe all the outcomes, not just the $45.9M maximum. The result would sound something like this, "the risk is between $38 million and $45.9 million, but most likely $42.4 million." Just like in the figure above, we have appropriately reduced the precision we communicate so as not to imply perfect data. We also appropriately couched our most likely outcome within a range to express to management more than just the worst case.
To summarize, the value of using VaR methods, such as FAIR, is they provide a computational framework that helps reduce the uncertainty in forecasting an organizations' risk landscape. This reduced uncertainty should translate to better decision making. The underlying formulas work appropriately and will provide results such as $45,890,034. That doesn't mean we should take them at face value when forecasting future loss. Management does not appreciate this predictive result. The bridge to overcome these pitfalls has two key pillars:
- Use ranges instead of discrete data points to describe your results.
- Use approximations of the dollar outcomes to appropriately reflect the uncertainty in the analysis process.
The RiskLens CyberRisk Quantification application handles these precision problems for you by enforcing distributions for data inputs and by appropriately rounding results to reflect the imprecision of your inputs.