
 The most frequent question I am asked after completing a quantitative cyber risk analysis with a customer is: “Which of these numbers should I use in my report?” Often, they are looking for a single magic number to help communicate information security risk in financial terms.
Spoiler alert: A Magic Risk Number does not exist. RiskLens equips you with many different metrics, which should be reviewed and selected to help you tell your story. Let’s go over a use case to highlight a few of the most important metrics and how they appear in reporting.
Use Cases: Cyber Risk Scenarios
As an analyst, you have just completed two risk scenarios within RiskLens:
-
A breach of PII from your Crown Jewel database by an External Actor
-
An outage of your Key System due to a misconfiguration error by a Privileged Insider
These are the results you see within the RiskLens platform:
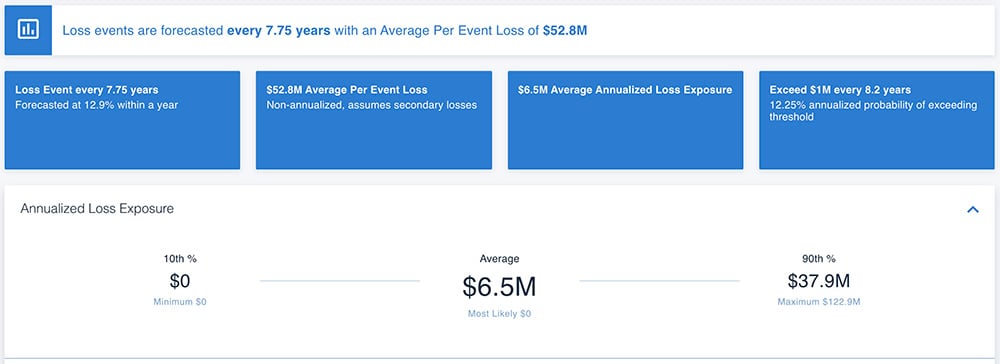
Data Breach by External Actor
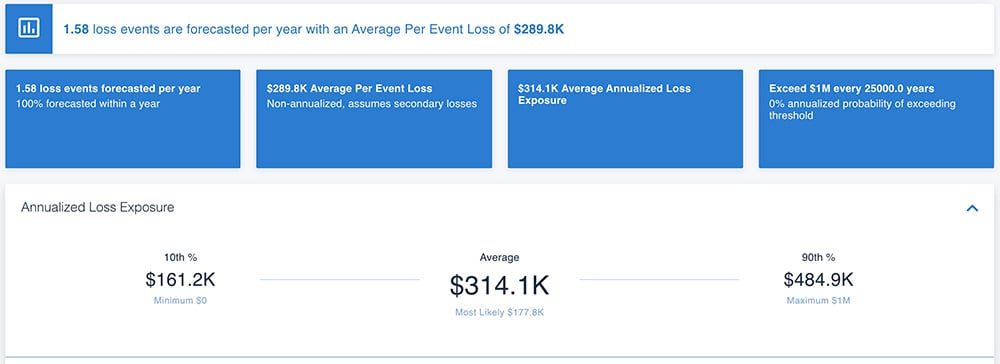
Outage from Misconfiguration Error
You want to present the results of both scenarios to stakeholders within your organization. Which numbers do you use?
Mary Laura Samples is a Risk Consultant for RiskLens
Communicating Risk in Ranges
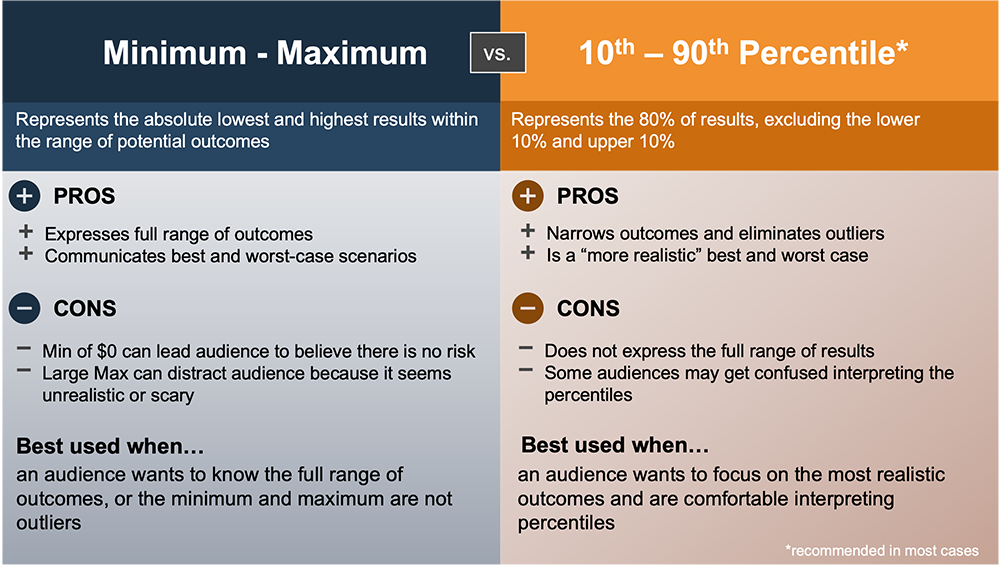
First things first, if you are familiar with the FAIR™ methodology, you know that all quantitative estimates are made using ranges. Similarly, we encourage all results to be communicated in ranges. This helps the audience understand that, as risk analysts, we are not making a prediction about a single value, but instead seek to estimate probabilistic outcomes. It also is a more accurate way to report risk, since ranges allow for accuracy without being overly precise.
There are two sets of metrics that allow us to communicate a range of results:
In our use case, the annualized values for each scenario are:
Data Breach by External Actor
-
Min - Max: $0 - $123M
-
10th - 90th: $0 - $38M
Outage from Misconfiguration Error
-
Min - Max: $0 - $1M
-
10th - 90th: $161K - $485K
In this case, since the maximums are two to three times the 90th percentile for both scenarios, it makes sense to focus on 10th - 90th since those represent more realistic outcomes.
Learn Factor Analysis of Information Risk (FAIR™), the standard for cyber risk quantification implemented on the RiskLens platform. FAIR training courses now available.
Annualized Loss or Per Event Loss?
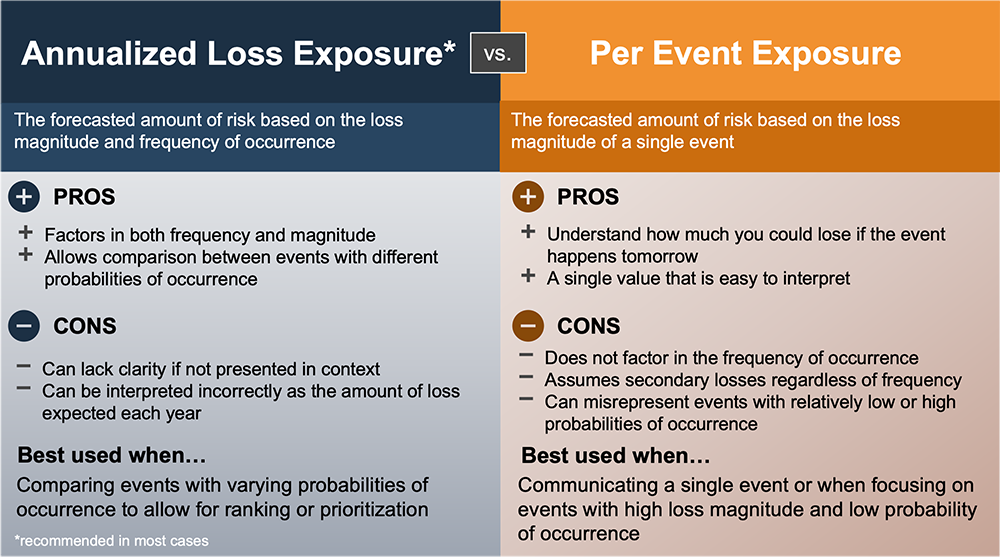
The above example communicated a range of annualized loss, but RiskLens also gives us the per event loss for each scenario. Here’s the difference and when to use which:
In our use case, our average annualized loss exposure and average per event loss exposure are:
Data Breach by External Actor
-
Annualized Loss Exposure: $6.5M
-
Per Event Loss Exposure: $53M
Outage from Misconfiguration Error
-
Annualized Loss Exposure: $314K
-
Per Event Loss Exposure: $290K
Since the Data Breach is only estimated to occur once every 8 years, the annualized value is lower than the per event value. On the other hand, since the Outage from Misconfiguration is estimated to occur more than once per year, the annualized loss exposure is higher than the per event value. With such different frequencies, the annualized value will allow us to compare the risk on an even playing field, which is great if you are looking to rank or prioritize these scenarios. On the other hand, if they are being presented separately, it might be more meaningful to focus on the per event loss exposure, since that is the amount of loss that will materialize if the event happens tomorrow.
Try FAIR analysis for yourself with the free training app FAIR-U
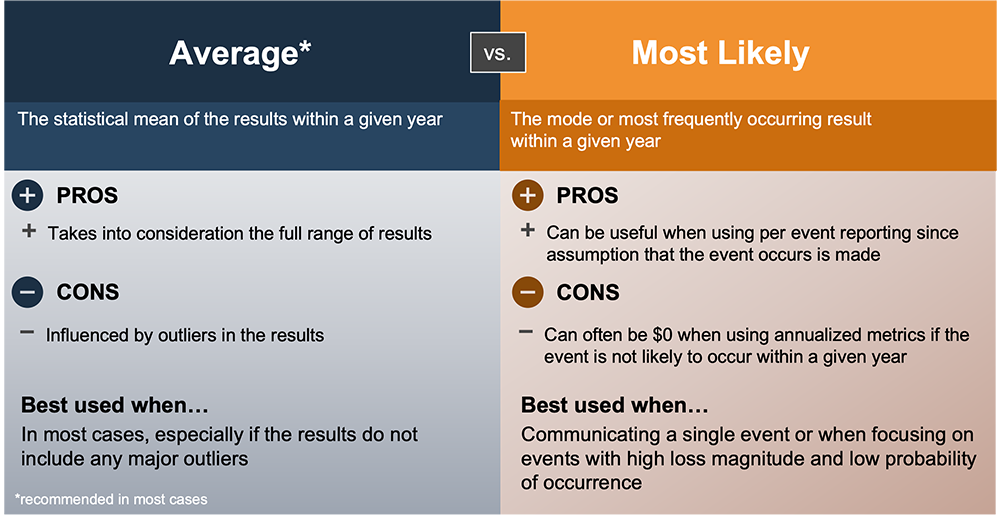
Average or Most Likely?
In addition to using a range to communicate the results, it can also be helpful to have a single value to point to, especially if you are using charts and graphs to show results. In the above example, we used the average value for the annualized and per event losses, but RiskLens also gives us a most likely value. Here’s the difference:
Database Breach by External Actor
-
Average Annualized Loss: $6.5M
-
Most Likely Annualized Loss: $0
-
Average Per Event Loss: $53M
-
Most Likely Per Event Loss: $49M
Outage from Misconfiguration Error
-
Average Annualized Loss: $314K
-
Most Likely Annualized Loss: $177K
-
Average Per Event Loss: $290K
-
Most Likely Per Event Loss: $288K
You can see that in the case of the Database Breach by an External Actor, it would not make sense to communicate the most likely annualized loss of $0. All that tells us is that the event is not likely to occur in the next year. On the other hand, in the case of the Misconfiguration Error, the most likely annualized value is useful since it’s likely to occur within the next year.
The Magic of Many Risk Numbers in Cyber Risk Management
In conclusion, there is no one Magic Risk Number to use for reporting risk. It takes an understanding of each metric, knowing your audience, and practice to know which numbers are the magic ones. Save these infographics to keep in your back pocket and you’ll be a risk magician in no time!
Learn more: What Does RiskLens Reporting Tell Me?
